

Volume 5, Issue 3 (Spring-Special Issue on COVID-19 2020)
Health in Emergencies and Disasters Quarterly 2020, 5(3): 145-154 |
Back to browse issues page


Download citation:
BibTeX | RIS | EndNote | Medlars | ProCite | Reference Manager | RefWorks
Send citation to:


BibTeX | RIS | EndNote | Medlars | ProCite | Reference Manager | RefWorks
Send citation to:
Shariati M, Jahangiri-rad M, Mahmud Muhammad F, Shariati J. Spatial Analysis of COVID-19 and Exploration of Its Environmental and Socio-Demographic Risk Factors Using Spatial Statistical Methods: A Case Study of Iran. Health in Emergencies and Disasters Quarterly 2020; 5 (3) :145-154
URL: http://hdq.uswr.ac.ir/article-1-297-en.html
URL: http://hdq.uswr.ac.ir/article-1-297-en.html


1- Department of Environmental Planning, College of Engineering, Faculty of Environment, Management and Education, University of Tehran, Tehran, Iran.
2- Department of Environmental Hygiene, School of Health and Medical Engineering and Psychology, Tehran Medical Sciences Branch, Islamic Azad University, Tehran, Iran.
3- Department of Epidemiology, School of Public Health, Tehran University of Medical Sciences, Tehran, Iran.
4- Department of Chemical Engineering, Darab Branch, Islamic Azad University, Darab, Iran.
Full-Text [PDF 1380 kb]
(1561 Downloads)
| Abstract (HTML) (2932 Views)


Full-Text: (1383 Views)
1. Introduction
Coronaviruses belong to the Coronaviridae family. They are a large group of viruses with positive-sense, single-stranded enveloped RNA found in animals and humans [1]. Two major coronavirus outbreaks in many countries, the Middle East respiratory syndrome coronavirus (MERS-COV) [2] and the severe acute respiratory syndrome coronavirus (SARS-COV) have been recorded [3]. The new Coronavirus disease 2019 (COVID-19) is an infectious disease caused by severe acute respiratory syndrome coronavirus 2 (SARS-COV-2) [4]. The disease was first identified in 2019 in Wuhan, the capital of Hubei in China, and has spread globally, resulting in a coronavirus pandemic [5]. According to the World Health Organization, the number of confirmed cases is 375,498 and the number of deaths is 16,362 across 196 countries on 23 March 2020 [6]. The mortality rate is 3.4 %; however, it ranges from 0.2% to 15%, according to age group and other health problems [7].
Since the epidemic of SARS and MERS, many studies have analyzed the viral transmission of the diseases using different techniques, like the SI model and spatial statistics to assess the spatial clustering of the coronaviruses [8, 9]. Understanding the viral transmission of COVID-19 is critical using a spatially explicit model. Iran detected its first COVID-19 case in February 2020 in Qom province, which rapidly spread to other cities in the country. Iran, as one of those countries with the highest number of infected people, has officially reported 1812 deaths among a total number of 23049 confirmed infected cases till now. Factors, ranging from the level of humidity, temperature, distance from the epicenter, to those, such as population density, socio-demographic characteristics, and level of urbanization may probably be the contributing factors, which change the pattern of prevalence of the novel infection in different areas. In the current study, statistical and spatial analysis were applied to determine spatial distribution and prevalence of COVID-19 infection associated with environmental and socio-demographic factors in the various provinces of Iran. This information is beneficial in identifying the regions with high risk for the disease and provide stakeholders with prioritizing public health interventions. The aim of this study was to exhibit the geographical and spatial distribution of the COVID-19 epidemic in all the provinces in Iran.
2. Materials and Methods
Study area
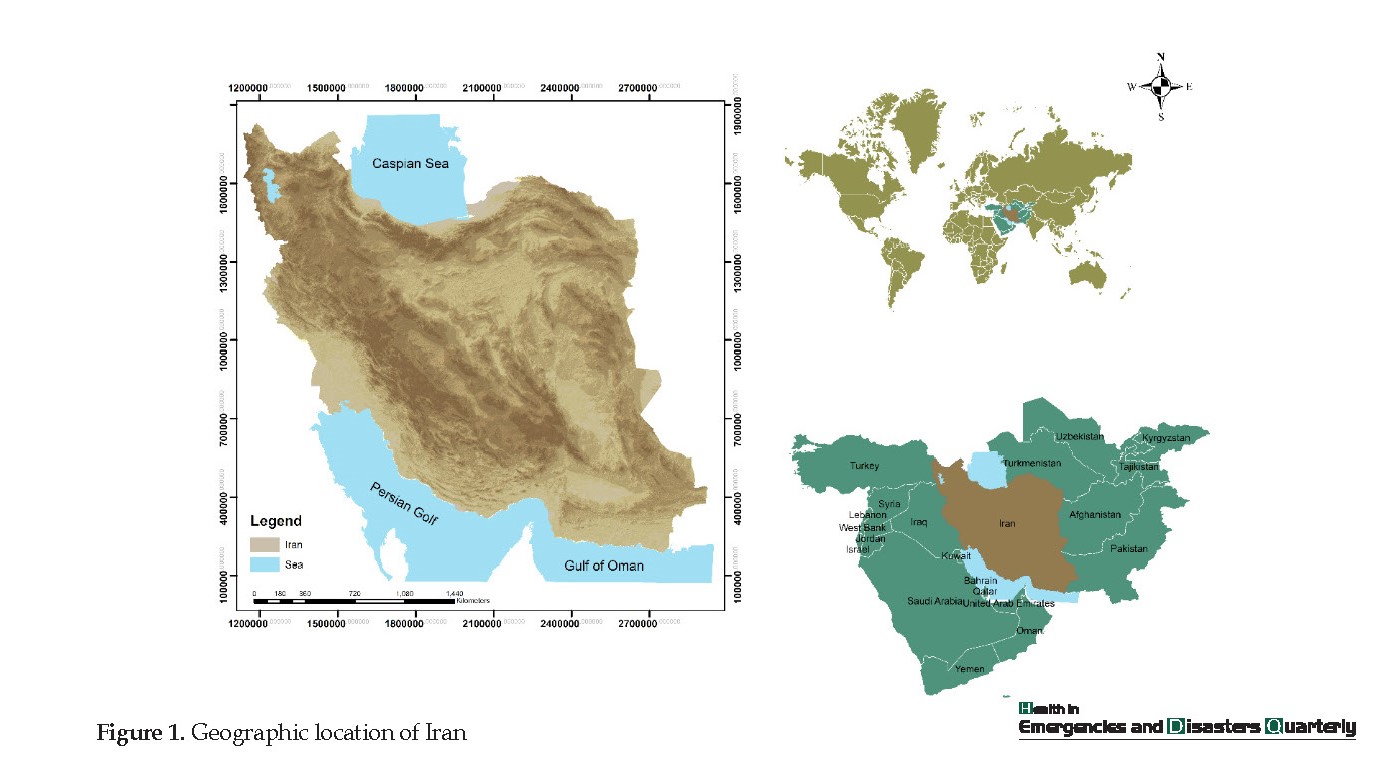
The Islamic Republic of Iran is located in Western Asia with a vast area of 1,648,195 km2. Iran is the second-largest and most populous country in the Middle East. The country has about 85 million people with the significant youth population actively involved in the production and other socio-economic activities. It shares borders Armenia, Azerbaijan, and Turkmenistan in the North, Turkey in the Northwest, Iraq in the West, Persian and Oman Gulf in the South and Afghanistan and Pakistan in the East and Southeast, respectively. With a diverse climate, Iran is an arid, semiarid subtropical area with annual precipitation of 680 mm (26.8 in) in the eastern parts and more than 1,700 mm (66.9 in) in the northern and western parts, respectively. The temperature, on the other hand, ranges from 5°C to 10°C and 20°C to 30°C or more in winters and summers, respectively. The country has thirty-one provinces administered from the capital Tehran [10].
COVID-19 cases data
Data on COVID -19 cases from 23 February to 22 March 2020 were collected from the Ministry of Health and Medical Education of Iran. Cases were detected using the diagnostic tool kits, which were confirmed in the hospital. A total number of 23049 cases from Iran provinces were used in the analysis. The number of recovered cases and deaths from COVID-19 was also considered. Figure 1 exhibits all data collected since the time of this study.
Coronaviruses belong to the Coronaviridae family. They are a large group of viruses with positive-sense, single-stranded enveloped RNA found in animals and humans [1]. Two major coronavirus outbreaks in many countries, the Middle East respiratory syndrome coronavirus (MERS-COV) [2] and the severe acute respiratory syndrome coronavirus (SARS-COV) have been recorded [3]. The new Coronavirus disease 2019 (COVID-19) is an infectious disease caused by severe acute respiratory syndrome coronavirus 2 (SARS-COV-2) [4]. The disease was first identified in 2019 in Wuhan, the capital of Hubei in China, and has spread globally, resulting in a coronavirus pandemic [5]. According to the World Health Organization, the number of confirmed cases is 375,498 and the number of deaths is 16,362 across 196 countries on 23 March 2020 [6]. The mortality rate is 3.4 %; however, it ranges from 0.2% to 15%, according to age group and other health problems [7].
Since the epidemic of SARS and MERS, many studies have analyzed the viral transmission of the diseases using different techniques, like the SI model and spatial statistics to assess the spatial clustering of the coronaviruses [8, 9]. Understanding the viral transmission of COVID-19 is critical using a spatially explicit model. Iran detected its first COVID-19 case in February 2020 in Qom province, which rapidly spread to other cities in the country. Iran, as one of those countries with the highest number of infected people, has officially reported 1812 deaths among a total number of 23049 confirmed infected cases till now. Factors, ranging from the level of humidity, temperature, distance from the epicenter, to those, such as population density, socio-demographic characteristics, and level of urbanization may probably be the contributing factors, which change the pattern of prevalence of the novel infection in different areas. In the current study, statistical and spatial analysis were applied to determine spatial distribution and prevalence of COVID-19 infection associated with environmental and socio-demographic factors in the various provinces of Iran. This information is beneficial in identifying the regions with high risk for the disease and provide stakeholders with prioritizing public health interventions. The aim of this study was to exhibit the geographical and spatial distribution of the COVID-19 epidemic in all the provinces in Iran.
2. Materials and Methods
Study area
The Islamic Republic of Iran is located in Western Asia with a vast area of 1,648,195 km2. Iran is the second-largest and most populous country in the Middle East. The country has about 85 million people with the significant youth population actively involved in the production and other socio-economic activities. It shares borders Armenia, Azerbaijan, and Turkmenistan in the North, Turkey in the Northwest, Iraq in the West, Persian and Oman Gulf in the South and Afghanistan and Pakistan in the East and Southeast, respectively. With a diverse climate, Iran is an arid, semiarid subtropical area with annual precipitation of 680 mm (26.8 in) in the eastern parts and more than 1,700 mm (66.9 in) in the northern and western parts, respectively. The temperature, on the other hand, ranges from 5°C to 10°C and 20°C to 30°C or more in winters and summers, respectively. The country has thirty-one provinces administered from the capital Tehran [10].
COVID-19 cases data
Data on COVID -19 cases from 23 February to 22 March 2020 were collected from the Ministry of Health and Medical Education of Iran. Cases were detected using the diagnostic tool kits, which were confirmed in the hospital. A total number of 23049 cases from Iran provinces were used in the analysis. The number of recovered cases and deaths from COVID-19 was also considered. Figure 1 exhibits all data collected since the time of this study.
Environmental and socio-demographic factors
The environmental factors considered in this analysis were humidity, temperature, precipitation, elevation, number of travels to provinces, and the distance from the epicenter. Other important socio-demographic factors were population, age, educational status, and vitamin D intake per province. The details of the mentioned parameters are shown in Table 1.
The COVID -19 incidence rate (cases per 100,000 population) was the measure used for the severity of disease in this analysis, which was assessed by Equation 1. The cumulative incidence rate is the proportion of the population at risk within a given period of time [11].
Eq. (1). Cumulative incidence rate=
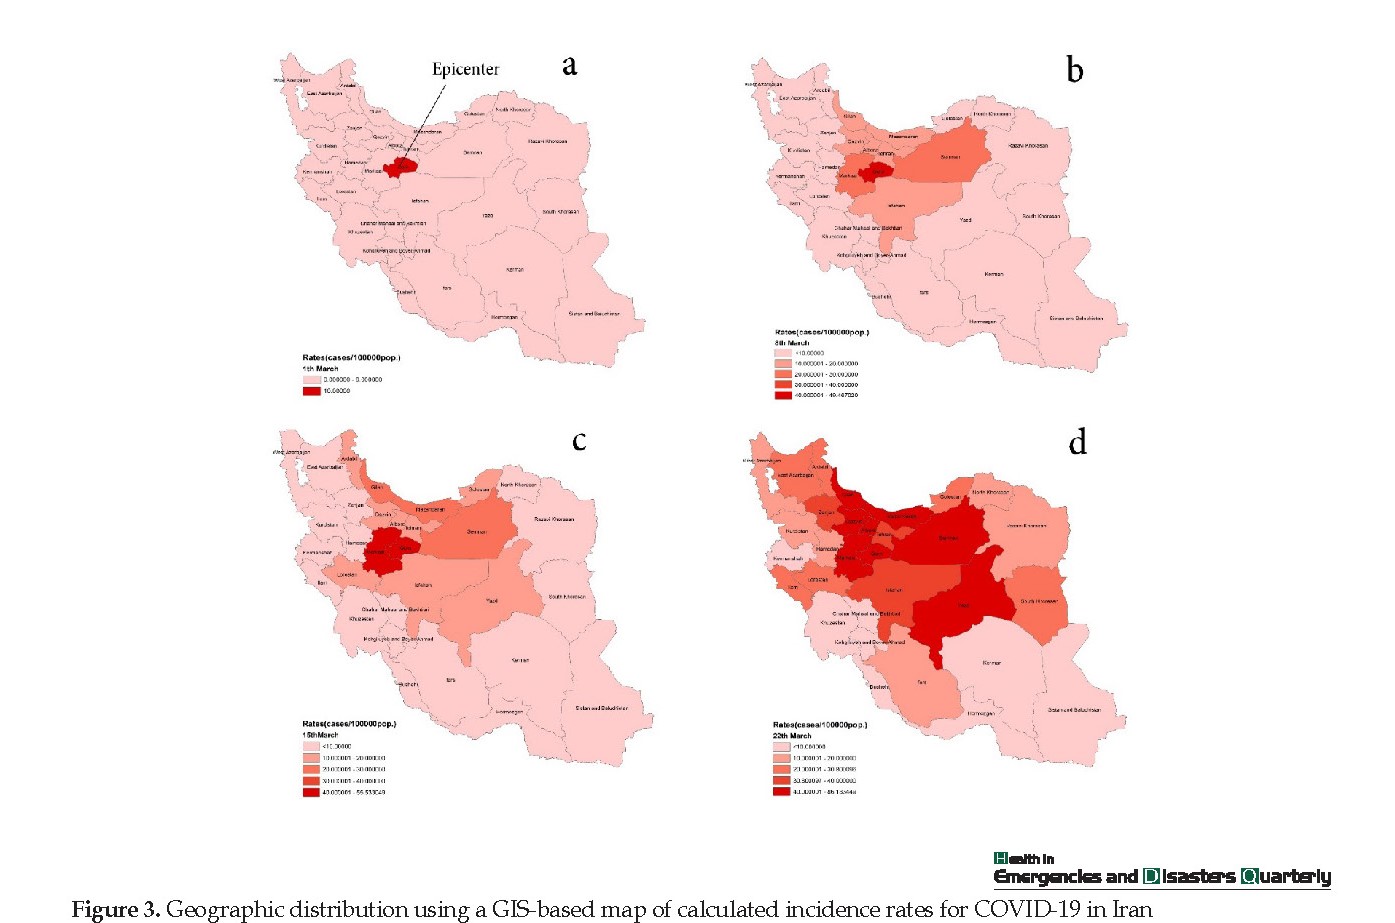
The cumulative incidence rate map in adjacent provinces to Qom (as the major infected city in Iran) is shown in Figure 2. As depicted, provinces, such as Bushehr, Chaharmahal and Bakhtiari, Kerman, Kermanshah, Khuzestan, Kohgiluyeh and Boyer-Ahmad, North Khorasan, Sistan and Baluchestan, and West Azerbaijan had the lowest cumulative incidence rate (CIR<10) from February 23 to March 22, 2020.
The cumulative incidence rate map in adjacent provinces to Qom (as the major infected city in Iran) is shown in Figure 2. As depicted, provinces, such as Bushehr, Chaharmahal and Bakhtiari, Kerman, Kermanshah, Khuzestan, Kohgiluyeh and Boyer-Ahmad, North Khorasan, Sistan and Baluchestan, and West Azerbaijan had the lowest cumulative incidence rate (CIR<10) from February 23 to March 22, 2020.
Spatial pattern analysis
Spatial autocorrelation (Global Moran’s I) [12], and hot spot analysis [13] were used to assess COVID-19 spatial patterns, such as spatial distribution characteristics, spatial clustering, and spatial hot spots in the Iran provinces. The spatial analysis methods were applied for the disease analysis. ‘Spatial autocorrelation’ (global Moran’s I) measures spatial autocorrelation based on both feature locations and feature values simultaneously. The global Moran’s I index values fall between _1.0 and +1.0. This index evaluates whether the pattern expressed is clustered (>0), dispersed (=0), or random (<0). The ‘hot spot analysis’ (Getis-Ord Gi*) calculates each feature in the dataset is a z-score. For statistically significant positive z-scores, the larger the z-score is, the more intense the clustering of high values (hot spot). For statistically significant negative z-scores, the smaller the z-score is, the more intense the clustering of low values (cold spot).
Spatial autocorrelation (Global Moran’s I) [12], and hot spot analysis [13] were used to assess COVID-19 spatial patterns, such as spatial distribution characteristics, spatial clustering, and spatial hot spots in the Iran provinces. The spatial analysis methods were applied for the disease analysis. ‘Spatial autocorrelation’ (global Moran’s I) measures spatial autocorrelation based on both feature locations and feature values simultaneously. The global Moran’s I index values fall between _1.0 and +1.0. This index evaluates whether the pattern expressed is clustered (>0), dispersed (=0), or random (<0). The ‘hot spot analysis’ (Getis-Ord Gi*) calculates each feature in the dataset is a z-score. For statistically significant positive z-scores, the larger the z-score is, the more intense the clustering of high values (hot spot). For statistically significant negative z-scores, the smaller the z-score is, the more intense the clustering of low values (cold spot).
Spatial statistical models
The ordinary Least Square (OLS) method was used to estimate the relationship between COVID - 19 and the risk factors. This method minimized the sum of squared differences between the observed response and the ones predicted from the explanatory method. OLS regression is a powerful technique for modeling continuous data, particularly when it is used in conjunction with dummy variable coding and data transformation [14]. The COVID-19 was the dependent variable used in the model. Trust in the model can be assessed according to six rules: 1. the coefficients have the expected signs; 2. there is no redundancy among explanatory variables; 3. the coefficients are statistically significant; 4. the residuals are normally distributed; 5. there is a strong adjusted R-square value; 6. the residuals are not spatially autocorrelated [15]. Collinearity was accounted for the variables utilized according to the six rules of the OLS model.
The ordinary Least Square (OLS) method was used to estimate the relationship between COVID - 19 and the risk factors. This method minimized the sum of squared differences between the observed response and the ones predicted from the explanatory method. OLS regression is a powerful technique for modeling continuous data, particularly when it is used in conjunction with dummy variable coding and data transformation [14]. The COVID-19 was the dependent variable used in the model. Trust in the model can be assessed according to six rules: 1. the coefficients have the expected signs; 2. there is no redundancy among explanatory variables; 3. the coefficients are statistically significant; 4. the residuals are normally distributed; 5. there is a strong adjusted R-square value; 6. the residuals are not spatially autocorrelated [15]. Collinearity was accounted for the variables utilized according to the six rules of the OLS model.
The least-square regression model interpretation was based on multi-collinearity, robust probability, adjusted R, and Akaike Information Criteria (AIC). The statistically significant variables were indicated by the robust probability, which shows their significance in the model. To examine the VIF values and robust probability, the OLS model was run several times until all the redundant variables were removed from the model. This procedure continued until narrowing down to non-redundant and significant variables. The AIC was then used to determine the best OLS model.
The next step was to explore Geographically Weighted Regression (GWR) models that might better explain the variation in COVID -19 cases based on the environmental and socio-demographic factors. Spatial autocorrelation (Global Moran’s I) was utilized to assess whether the environmental and socio-demographic factors exhibited a random spatial pattern [16], and where adequate models have a random distribution of the residuals [17].
Geographically weighted regression
Under the assumption that the strength and direction of the relationship between the dependent variable and its predictors may be modified by contextual factors, the GWR model was applied. The results were analyzed using the spatial relationship tools within the spatial statistics toolbox in the ArcGIS Arc toolbox. The explanatory variables used in OLS were used in the GWR modeling in other to access the difference in model improvement, which can be due to modeling approach or environmental and socio-demographic factors. The GWR model was applied to analyze the relationship between COVID-19 cases and environmental and socio-demographic factors changes from one province to another. The GWR detects spatial variation and shows how the relationship varies in space and produces information useful for interpreting spatial non-stationarity [18].
3. Results
Spatial analysis of COVID-19
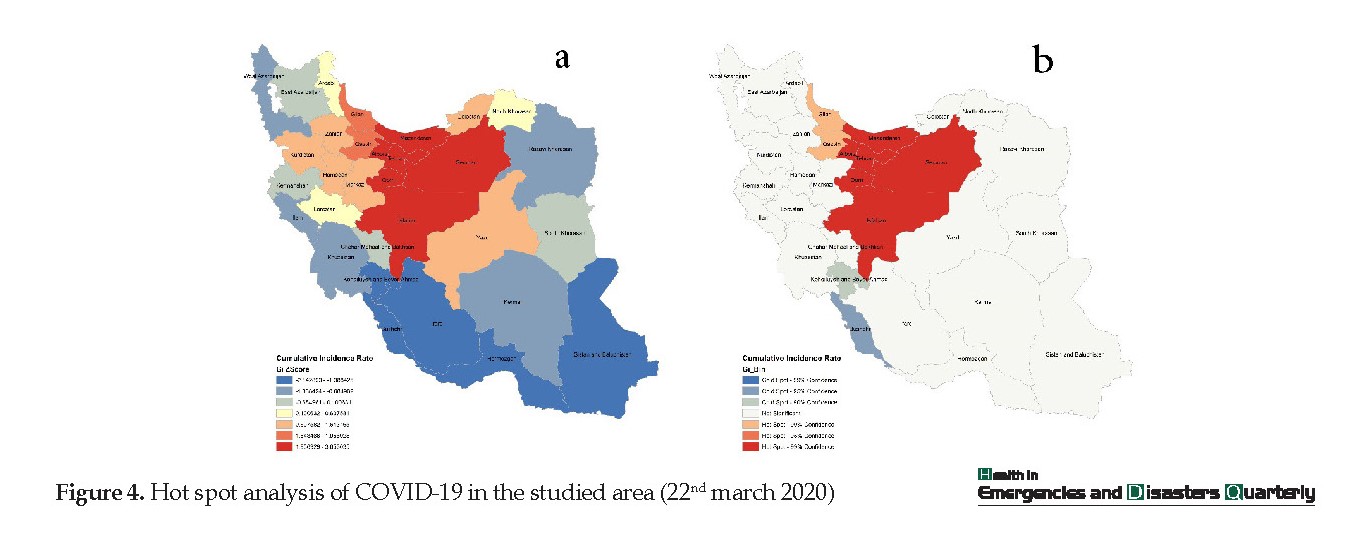
The spatial autocorrelation (Global Moran’s I) result showed that COVID-19 cases in the studied area were in clustered patterns, with a Moran’s index of 0.65 and a p-value of less than 0.01. The hot spot analysis (Getis-Ord Gi*) results are given in Figure 3.
For statistically significant positive z-scores, the larger the z-score is, the more intense the clustering of high values (hot spot), such as Semnan, Qom, Isfahan, Mazandaran, Alborz, and Tehran. For statistically significant negative z-scores, the smaller the z-score is, the more intense the clustering of low values (cold spot), such as Sistan and Baluchistan, Hormozgan, Bushehr, Fars, Kohgiluyeh and Boyer-Ahmad (Figure 4a).
Figure 4b demonstrates the clustering of high values (hot spot) with a confidence level of 99% for Semnan, Qom, Isfahan, Mazandaran, Alborz, and Tehran. The indicator detected clustering of low values (cold spot) for Bushehr and Kohgiluyeh and Boyer-Ahmad with a confidence level of 99% and 95%, respectively.
Identifying environmental and socio-demographic risk factors of COVID-19
Risk factors were first entered into the model. Then, according to the six rules of OLS model availability, the risk factors were removed from the model step by step. Finally, one risk factor was adopted in the model (Table 2). The adjusted R-squared was 0.328 with a corresponding corrected AIC of 259.75. The following model was obtained:
Y=34.86+(-0.00004)X
Where, Y and X indicate the incidence rate of COVID -19, and distance from the epicenter, respectively, which were expressed as the number per 100000.
a. Coefficient: Represents the strength and type of relationship between each explanatory variable and the dependent variable.
b. Probability and Robust Probability (Robust_Pr): the asterisk (*) indicates that the coefficient is statistically significant (P<0.01); if the Koenker (BP) Statistic [f] is statistically significant, use the Robust Probability column (Robust_Pr) to determine coefficient significance.
c. Variance Inflation Factor (VIF): Large Variance InFlation Factor (VIF) values (>7.5) indicate redundancy among explanatory variables.
d. R-Squared and Akaike’s Information Criterion (AICc): Measures of model fit/performance.
e. Joint F and Wald Statistics: The asterisk (*) indicates overall model significance (P<0.01); if the Koenker (BP) Statistic [f] is statistically significant, use the Wald Statistic to determine overall model significance.
f. Koenker (BP) Statistic: When this test is statistically significant (P<0.01), the relationships modeled are not consistent (either due to non-stationarity or heteroskedasticity). You should rely on the Robust Probabilities (Robust_Pr) to determine coefficient significance and on the Wald Statistic to determine overall model significance.
g. Jarque-Bera Statistic: When this test is statistically significant (P<0.01), the model predictions are biased (the residuals are not normally distributed).
Geographically Weighted Regression (GWR)
The local GWR model produced an adjusted R2 of 0.44 (P<0.05) with a corresponding corrected AIC of 255.50. A 4-point decrease in the AIC and approximately 4% improvement in the model performance suggested that incorporating spatial data improved the predictive ability of COVID -19 risk. Figure 5a maps the values of the standardized residual across Iran. This figure provides a representation of a. areas with unusually high or low residuals; and b. whether the residuals were spatially autocorrelated. Provinces with excessively large positive residuals would under-predict the incidence rate of COVID -19, such as Semnan and Qom; though, provinces with excessively large negative residuals would over-predict the incidence rate of COVID -19, such as Hamedan and Chaharmahaal and Bakhtiari. The spatial autocorrelation of GWR residuals for the model resulted in a Moran’s I value of 0.042 (P=0.45).
Given the z-score of 0.74, the pattern does not appear to be significantly different than random. Figure 5b shows the variation in the models of the distance from the epicenter. The map for the local coefficients GWR revealed variations among the different provinces. The local coefficient ranged from -0.000075 for the westernmost province to 0.000035 for the southernmost and Easternmost provinces. Distance from epicenter demonstrated a negative relation to the incidence rate of COVID-19. Mapping this coefficient shows how the relationship between each explanatory and dependent variable changes across the studied area. The red areas show a large coefficient and the mapped explanatory variables exhibit strong prediction [15].
4. Discussion
Spatial distribution is important for monitoring and identifying how diseases spread over an area [19]. Spatial distributions of the calculated CIR showed Qom province and its nearest areas as the possible center of the disease. A high incidence of COVID-19 was found in areas close to this center. The highest prevalence of the afflicted cases was observed in Tehran and Mazandaran. Medical geospatial analysis has been extensively used as an effective tool for making precise trend that estimates of various epidemic diseases [20]. Spatiotemporal techniques are capable of discerning geographical clusters of the outbreaks [21].
In the this study, this technique was applied to examine the spatiotemporal variation of COVID-19 in Iran from 23 February to 22 March 2020. The Global Moran’s I value of 0.65 (P<0.01) showed a notable clustering of CIR in the studied area. 6 Hot and 2 Cold spots provinces were detected by spatial statistical analysis, which all were statistically significant. The high-risk provinces identified for COVID-19 were Semnan, Qom, Isfahan, Mazandaran, Alborz, and Tehran, which are located in the northern and central parts of Iran. The regions adjacent to the epicenter (Qom) are the locations of the utmost intense clustering regions at high risk. This study was conducted on the use of two common methods; namely, geographical and statistical information. In this research, spatial statistical methods were used to investigate spatial patterns of COVID-19 cases along with the correlations between COVID-19 and risk factors. This technique refines the perception of variations in spatial patterns of COVID-19 and provides insights into environmental and socio-demographic risk factors’ effects on COVID-19; thereby enabling effective support for preventing and controlling objectively.
A Global OLS model is applicable in spatial regression models for examining the correlation between COVID-19 and possible descriptive factors dependent on the presumption that the correlation is a stationary spatial model [22]. The OLS model of COVID-19 was built successfully with COVID-19 cases as the dependent variable and the risk factor of distance from epicenter as the explanatory variable. Contrary to expectation, variables, such as the number of travels to provinces, due to the arrival of Nowruz holidays in Iran, have not significantly correlated with the prevalence rate of the disease until the time of this survey; indicating the government’s preventive measures, the high level of people compliances with the instructions of the Ministry of Health, and sufficient information of the Iranian broadcasting.
However, some researchers identified vitamin D deficiency as the possible cause of developing respiratory illnesses, like COVID-19 [23, 24], no significant association was found between the levels of vitamin D and COVID-19 prevalence rates in this study. In order to build a valid model and predict the prevalence rate of COVID-19, other variables should be added to the model. However, lack of access to other influential data, like economic and political factors led us to ignore these variables in the current study. According to the data collected during the time of the current research, the highest CIR was concentrated around Qom. In addition, the greater the distance from the center of prevalence (Qom), the fewer the patients. Hot spot analysis also implied that the neighboring provinces of the prevalence centers had hot spots with a 99% confidence level. The results of OLS analysis indicated the significant correlation between CIR and the distance from epicenter (Qom).
The use of the local GWR model has given more credibility in modeling diseases than the global OLS model [25]. According to Fotheringham [26], the use of GWR is beneficial as it encompasses most of the spatial autocorrelation in the residuals, which are normally present in global modeling. Furthermore, it may happen for a globally non-significant variable to possibly become of local importance.
The GWR can result in the spatial granularity, providing an opportunity to well understand the relationship between the environmental spatial heterogeneity and COVID-19 risk as entailed by the infection of CIR with COVID-19. This method helps to legislate managerial policies for public health more precisely.
To sum up, COVID-19, a globally emerging contagious disease, was reported to have a heterogeneous relationship with distance from epicenter (Qom) in the course of our data collection period. The present observations can be helpful to people concerned with risk assessments for COVID-19 through aiding local public health institutions for an epidemic based on regionally specified circumstances. The results of the present study are very detailed and could provide accurate information to control and prevent the COVID-19 further outbreak.
5. Conclusion
1. According to the data collected over a period of one month, the highest CIR was concentrated around Qom, as provinces that located farther away from Qom as a hot spot, were less affected.
2. The analysis of hotspots also showed the existence of hotspots in the neighboring provinces of Qom with a 99% confidence level.
3. Based on the results of the OLS analysis, out of the 9 variables included in the models, only the distance from Qom demonstrated a significant relation with CIR.
4. In terms of the coefficient distance effects from Qom, the highest coefficients were related to the southern and eastern provinces; while, the northeastern provinces exhibited lower coefficients.
Ethical Considerations
Compliance with ethical guidelines
All ethical principles are considered in this article.
Funding
This research did not receive any grant from funding agencies in the public, commercial, or non-profit sectors.
Authors' contributions
All authors contributed preparing this article
Conflict of interest
The authors declared no conflict of interest.
References
van der Hoek L, Pyrc K, Jebbink MF, Vermeulen-Oost W, Berkhout RJ, Wolthers KC, et al. Identification of a new human coronavirus. Nature Medicine. 2004; 10(4):368-73. [DOI:10.1038/nm1024] [PMID] [PMCID]
Abroug F, Slim A, Ouanes-Besbes L, Kacem M-AH, Dachraoui F, Ouanes I, et al. Family cluster of Middle East respiratory syndrome coronavirus infections, Tunisia, 2013. Emerging Infectious Diseases. 2014; 20(9):1527. [DOI:10.3201/eid2009.140378] [PMID] [PMCID]
Peiris J, Lai S, Poon L, Guan Y, Yam L, Lim W, et al. Coronavirus as a possible cause of severe acute respiratory syndrome. The Lancet. 2003; 361(9366):1319-25. [DOI:10.1016/S0140-6736(03)13077-2]
WHO. Technical guidance. Naming the Coronaviru disease (COVID-19) and the virus that causes it [Internet]. 2020 [Updated 2020]. Available from: https://www.who.int/emergencies/diseases/novel-coronavirus-2019/technical-guidance/naming-the-coronavirus-disease-(covid-2019)-and-the-virus-that-causes-it
WHO. Director-General’s opening remarks at the media briefing on COVID-19 [Internet]. 2019 [Updated 2020 March 11]. Available from: https://www.who.int/director-general/speeches/detail/who-director-general-s-opening-remarks-at-the-media-briefing-on-covid-19---11-march-2020
WHO. Coronavirus disease (COVID-19) pandemic [Internet]. 2020 [Updated 2020 November 23]. Available from: https://www.who.int/emergencies/diseases/novel-coronavirus-2019
Worldometers. COVID-19 Coronavirus Pandemic [Internet]. 2020 [Updated 2020 November 23]. Available from: https://www.worldometers.info/coronavirus/?utm_campaign=homeAdUOA?Si.
Cao Z, Zeng D, Zheng X, Wang Q, Wang F, Wang J, et al. Spatio-temporal evolution of Beijing 2003 SARS epidemic. Science China Earth Sciences. 2010; 53(7):1017-28. [DOI:10.1007/s11430-010-0043-x] [PMID] [PMCID]
Al‐Ahmadi K, Alahmadi M, Al‐Zahrani A. Spatial association between primary Middle East respiratory syndrome coronavirus infection and exposure to dromedary camels in Saudi Arabia. Zoonoses and Public Health. 2020; 67(4):382-90. [DOI:10.1111/zph.12697] [PMID] [PMCID]
Holakouie-Naieni K, Mostafavi E, Boloorani AD, Mohebali M, Pakzad R. Spatial modeling of cutaneous leishmaniasis in Iran from 1983 to 2013. Acta Tropica. 2017; 166:67-73. [DOI:10.1016/j.actatropica.2016.11.004] [PMID]
Rothman KJ, Greenland S, Lash TL. Modern epidemiology. Philadelphia: Lippincott Williams & Wilkins; 2008.
Mitchell A. The ESRI guide to GIS analysis, Volume 2: Spatial measurements and statistics (The Esri Guide to GIS Analysis (4)) 1st edition. ESRI Press; 2005.
Scott L, Warmer dam N. Extend crime analysis: With ArcGIS spatial statistics tools. In: Arc User online. 2005; 8(2):1-4. https://www.esri.com/library/reprints/pdfs/arcuser_extend-crime-analysis.pdf
Hutcheson GD. Ordinary Least-Squares Regression. In: Moutinho, L. and Hutcheson, G.D., The SAGE Dictionary of Quantitative Management Research, SAGE Publications, Thousand Oaks. 2011; 224-8. [DOI:10.4135/9781446251119.n67]
ESRI. Regression analysis tutorial for ArcGIS 10. ESRI Press; 2017.
Goodchild MF. What problem? Spatial autocorrelation and geographic information science. 1998; 1-11. http://www.geog.ucsb.edu/~good/papers/479.pdf
Mitchell A. The ESRI guide to GIS analysis: Spatial measurements and statistics. Vol. 2. Redlands: ESRI Press; 2005.
Brunsdon C, Fotheringham AS, Charlton ME. Geographically weighted regression: a method for exploring spatial non stationarity. Geographical Analysis. 1996; 28(4):281-98. [DOI:10.1111/j.1538-4632.1996.tb00936.x]
Pickle LW. Spatial Analysis of Disease. In: Biostatistical Applications in Cancer Research. vol. 113. Boston, MA: Springer; 2002. [DOI:10.1007/978-1-4757-3571-0_7]
Dickin SK, Schuster-Wallace CJ, Elliott SJ. Developing a vulnerability mapping methodology: Applying the water-associated disease index to dengue in Malaysia. PLoS One. 2013; 8(5):e63584. [DOI:10.1371/journal.pone.0063584] [PMID] [PMCID]
Neill, D.B. Detection of spatial and spatio-temporal clusters. Tech. Rep. CMU-CS-06-142. [Ph.D. Thesis]. Pittsburgh, PA: Carnegie Mellon University; 2006.
Miller JA. Species distribution models Spatial autocorrelation and non-stationarity. Progress in Physical Geography. 2012; 36:681-92. [DOI:10.1177/0309133312442522]
Grant WB, Lahore H, McDonnell SL, Baggerly CA, French CB, Aliano JL, et al. Evidence that vitamin D supplementation could reduce risk of Influenza and COVID-19 Infections and Deaths. Nutrients. 2020; 12(4):988. [DOI:10.3390/nu12040988] [PMID] [PMCID]
Condon D. Vitamin D could have key role in COVID-19 response. Irishhealth [Internet]. [Nov 01, 2020]. Available from: http://www.irishhealth.com/article.html?id=27110
Foley R, Charlton MC, Fotheringham AS. GIS in health and social care planning. In: Handbook of Theoretical and Quantitative Geography, UNIL-FGSE-Workshop series (2). Lausanne: Univ.de Lausanne- Faculté des géosciences et de l’environnement. 2009; 73-115. http://mural.maynoothuniversity.ie/2990/1/FoleyCharltonFotheringham_Final.pdf
Fotheringham AS. Geographically weighted regression. In: The SAGE Hand Book o Spatial Analysis. London: Sage Publications; 2009.
Under the assumption that the strength and direction of the relationship between the dependent variable and its predictors may be modified by contextual factors, the GWR model was applied. The results were analyzed using the spatial relationship tools within the spatial statistics toolbox in the ArcGIS Arc toolbox. The explanatory variables used in OLS were used in the GWR modeling in other to access the difference in model improvement, which can be due to modeling approach or environmental and socio-demographic factors. The GWR model was applied to analyze the relationship between COVID-19 cases and environmental and socio-demographic factors changes from one province to another. The GWR detects spatial variation and shows how the relationship varies in space and produces information useful for interpreting spatial non-stationarity [18].
3. Results
Spatial analysis of COVID-19
The spatial autocorrelation (Global Moran’s I) result showed that COVID-19 cases in the studied area were in clustered patterns, with a Moran’s index of 0.65 and a p-value of less than 0.01. The hot spot analysis (Getis-Ord Gi*) results are given in Figure 3.
For statistically significant positive z-scores, the larger the z-score is, the more intense the clustering of high values (hot spot), such as Semnan, Qom, Isfahan, Mazandaran, Alborz, and Tehran. For statistically significant negative z-scores, the smaller the z-score is, the more intense the clustering of low values (cold spot), such as Sistan and Baluchistan, Hormozgan, Bushehr, Fars, Kohgiluyeh and Boyer-Ahmad (Figure 4a).
Figure 4b demonstrates the clustering of high values (hot spot) with a confidence level of 99% for Semnan, Qom, Isfahan, Mazandaran, Alborz, and Tehran. The indicator detected clustering of low values (cold spot) for Bushehr and Kohgiluyeh and Boyer-Ahmad with a confidence level of 99% and 95%, respectively.
Identifying environmental and socio-demographic risk factors of COVID-19
Risk factors were first entered into the model. Then, according to the six rules of OLS model availability, the risk factors were removed from the model step by step. Finally, one risk factor was adopted in the model (Table 2). The adjusted R-squared was 0.328 with a corresponding corrected AIC of 259.75. The following model was obtained:
Y=34.86+(-0.00004)X
Where, Y and X indicate the incidence rate of COVID -19, and distance from the epicenter, respectively, which were expressed as the number per 100000.
a. Coefficient: Represents the strength and type of relationship between each explanatory variable and the dependent variable.
b. Probability and Robust Probability (Robust_Pr): the asterisk (*) indicates that the coefficient is statistically significant (P<0.01); if the Koenker (BP) Statistic [f] is statistically significant, use the Robust Probability column (Robust_Pr) to determine coefficient significance.
c. Variance Inflation Factor (VIF): Large Variance InFlation Factor (VIF) values (>7.5) indicate redundancy among explanatory variables.
d. R-Squared and Akaike’s Information Criterion (AICc): Measures of model fit/performance.
e. Joint F and Wald Statistics: The asterisk (*) indicates overall model significance (P<0.01); if the Koenker (BP) Statistic [f] is statistically significant, use the Wald Statistic to determine overall model significance.
f. Koenker (BP) Statistic: When this test is statistically significant (P<0.01), the relationships modeled are not consistent (either due to non-stationarity or heteroskedasticity). You should rely on the Robust Probabilities (Robust_Pr) to determine coefficient significance and on the Wald Statistic to determine overall model significance.
g. Jarque-Bera Statistic: When this test is statistically significant (P<0.01), the model predictions are biased (the residuals are not normally distributed).
Geographically Weighted Regression (GWR)
The local GWR model produced an adjusted R2 of 0.44 (P<0.05) with a corresponding corrected AIC of 255.50. A 4-point decrease in the AIC and approximately 4% improvement in the model performance suggested that incorporating spatial data improved the predictive ability of COVID -19 risk. Figure 5a maps the values of the standardized residual across Iran. This figure provides a representation of a. areas with unusually high or low residuals; and b. whether the residuals were spatially autocorrelated. Provinces with excessively large positive residuals would under-predict the incidence rate of COVID -19, such as Semnan and Qom; though, provinces with excessively large negative residuals would over-predict the incidence rate of COVID -19, such as Hamedan and Chaharmahaal and Bakhtiari. The spatial autocorrelation of GWR residuals for the model resulted in a Moran’s I value of 0.042 (P=0.45).
Given the z-score of 0.74, the pattern does not appear to be significantly different than random. Figure 5b shows the variation in the models of the distance from the epicenter. The map for the local coefficients GWR revealed variations among the different provinces. The local coefficient ranged from -0.000075 for the westernmost province to 0.000035 for the southernmost and Easternmost provinces. Distance from epicenter demonstrated a negative relation to the incidence rate of COVID-19. Mapping this coefficient shows how the relationship between each explanatory and dependent variable changes across the studied area. The red areas show a large coefficient and the mapped explanatory variables exhibit strong prediction [15].
4. Discussion
Spatial distribution is important for monitoring and identifying how diseases spread over an area [19]. Spatial distributions of the calculated CIR showed Qom province and its nearest areas as the possible center of the disease. A high incidence of COVID-19 was found in areas close to this center. The highest prevalence of the afflicted cases was observed in Tehran and Mazandaran. Medical geospatial analysis has been extensively used as an effective tool for making precise trend that estimates of various epidemic diseases [20]. Spatiotemporal techniques are capable of discerning geographical clusters of the outbreaks [21].
In the this study, this technique was applied to examine the spatiotemporal variation of COVID-19 in Iran from 23 February to 22 March 2020. The Global Moran’s I value of 0.65 (P<0.01) showed a notable clustering of CIR in the studied area. 6 Hot and 2 Cold spots provinces were detected by spatial statistical analysis, which all were statistically significant. The high-risk provinces identified for COVID-19 were Semnan, Qom, Isfahan, Mazandaran, Alborz, and Tehran, which are located in the northern and central parts of Iran. The regions adjacent to the epicenter (Qom) are the locations of the utmost intense clustering regions at high risk. This study was conducted on the use of two common methods; namely, geographical and statistical information. In this research, spatial statistical methods were used to investigate spatial patterns of COVID-19 cases along with the correlations between COVID-19 and risk factors. This technique refines the perception of variations in spatial patterns of COVID-19 and provides insights into environmental and socio-demographic risk factors’ effects on COVID-19; thereby enabling effective support for preventing and controlling objectively.
A Global OLS model is applicable in spatial regression models for examining the correlation between COVID-19 and possible descriptive factors dependent on the presumption that the correlation is a stationary spatial model [22]. The OLS model of COVID-19 was built successfully with COVID-19 cases as the dependent variable and the risk factor of distance from epicenter as the explanatory variable. Contrary to expectation, variables, such as the number of travels to provinces, due to the arrival of Nowruz holidays in Iran, have not significantly correlated with the prevalence rate of the disease until the time of this survey; indicating the government’s preventive measures, the high level of people compliances with the instructions of the Ministry of Health, and sufficient information of the Iranian broadcasting.
However, some researchers identified vitamin D deficiency as the possible cause of developing respiratory illnesses, like COVID-19 [23, 24], no significant association was found between the levels of vitamin D and COVID-19 prevalence rates in this study. In order to build a valid model and predict the prevalence rate of COVID-19, other variables should be added to the model. However, lack of access to other influential data, like economic and political factors led us to ignore these variables in the current study. According to the data collected during the time of the current research, the highest CIR was concentrated around Qom. In addition, the greater the distance from the center of prevalence (Qom), the fewer the patients. Hot spot analysis also implied that the neighboring provinces of the prevalence centers had hot spots with a 99% confidence level. The results of OLS analysis indicated the significant correlation between CIR and the distance from epicenter (Qom).
The use of the local GWR model has given more credibility in modeling diseases than the global OLS model [25]. According to Fotheringham [26], the use of GWR is beneficial as it encompasses most of the spatial autocorrelation in the residuals, which are normally present in global modeling. Furthermore, it may happen for a globally non-significant variable to possibly become of local importance.
The GWR can result in the spatial granularity, providing an opportunity to well understand the relationship between the environmental spatial heterogeneity and COVID-19 risk as entailed by the infection of CIR with COVID-19. This method helps to legislate managerial policies for public health more precisely.
To sum up, COVID-19, a globally emerging contagious disease, was reported to have a heterogeneous relationship with distance from epicenter (Qom) in the course of our data collection period. The present observations can be helpful to people concerned with risk assessments for COVID-19 through aiding local public health institutions for an epidemic based on regionally specified circumstances. The results of the present study are very detailed and could provide accurate information to control and prevent the COVID-19 further outbreak.
5. Conclusion
1. According to the data collected over a period of one month, the highest CIR was concentrated around Qom, as provinces that located farther away from Qom as a hot spot, were less affected.
2. The analysis of hotspots also showed the existence of hotspots in the neighboring provinces of Qom with a 99% confidence level.
3. Based on the results of the OLS analysis, out of the 9 variables included in the models, only the distance from Qom demonstrated a significant relation with CIR.
4. In terms of the coefficient distance effects from Qom, the highest coefficients were related to the southern and eastern provinces; while, the northeastern provinces exhibited lower coefficients.
Ethical Considerations
Compliance with ethical guidelines
All ethical principles are considered in this article.
Funding
This research did not receive any grant from funding agencies in the public, commercial, or non-profit sectors.
Authors' contributions
All authors contributed preparing this article
Conflict of interest
The authors declared no conflict of interest.
References
van der Hoek L, Pyrc K, Jebbink MF, Vermeulen-Oost W, Berkhout RJ, Wolthers KC, et al. Identification of a new human coronavirus. Nature Medicine. 2004; 10(4):368-73. [DOI:10.1038/nm1024] [PMID] [PMCID]
Abroug F, Slim A, Ouanes-Besbes L, Kacem M-AH, Dachraoui F, Ouanes I, et al. Family cluster of Middle East respiratory syndrome coronavirus infections, Tunisia, 2013. Emerging Infectious Diseases. 2014; 20(9):1527. [DOI:10.3201/eid2009.140378] [PMID] [PMCID]
Peiris J, Lai S, Poon L, Guan Y, Yam L, Lim W, et al. Coronavirus as a possible cause of severe acute respiratory syndrome. The Lancet. 2003; 361(9366):1319-25. [DOI:10.1016/S0140-6736(03)13077-2]
WHO. Technical guidance. Naming the Coronaviru disease (COVID-19) and the virus that causes it [Internet]. 2020 [Updated 2020]. Available from: https://www.who.int/emergencies/diseases/novel-coronavirus-2019/technical-guidance/naming-the-coronavirus-disease-(covid-2019)-and-the-virus-that-causes-it
WHO. Director-General’s opening remarks at the media briefing on COVID-19 [Internet]. 2019 [Updated 2020 March 11]. Available from: https://www.who.int/director-general/speeches/detail/who-director-general-s-opening-remarks-at-the-media-briefing-on-covid-19---11-march-2020
WHO. Coronavirus disease (COVID-19) pandemic [Internet]. 2020 [Updated 2020 November 23]. Available from: https://www.who.int/emergencies/diseases/novel-coronavirus-2019
Worldometers. COVID-19 Coronavirus Pandemic [Internet]. 2020 [Updated 2020 November 23]. Available from: https://www.worldometers.info/coronavirus/?utm_campaign=homeAdUOA?Si.
Cao Z, Zeng D, Zheng X, Wang Q, Wang F, Wang J, et al. Spatio-temporal evolution of Beijing 2003 SARS epidemic. Science China Earth Sciences. 2010; 53(7):1017-28. [DOI:10.1007/s11430-010-0043-x] [PMID] [PMCID]
Al‐Ahmadi K, Alahmadi M, Al‐Zahrani A. Spatial association between primary Middle East respiratory syndrome coronavirus infection and exposure to dromedary camels in Saudi Arabia. Zoonoses and Public Health. 2020; 67(4):382-90. [DOI:10.1111/zph.12697] [PMID] [PMCID]
Holakouie-Naieni K, Mostafavi E, Boloorani AD, Mohebali M, Pakzad R. Spatial modeling of cutaneous leishmaniasis in Iran from 1983 to 2013. Acta Tropica. 2017; 166:67-73. [DOI:10.1016/j.actatropica.2016.11.004] [PMID]
Rothman KJ, Greenland S, Lash TL. Modern epidemiology. Philadelphia: Lippincott Williams & Wilkins; 2008.
Mitchell A. The ESRI guide to GIS analysis, Volume 2: Spatial measurements and statistics (The Esri Guide to GIS Analysis (4)) 1st edition. ESRI Press; 2005.
Scott L, Warmer dam N. Extend crime analysis: With ArcGIS spatial statistics tools. In: Arc User online. 2005; 8(2):1-4. https://www.esri.com/library/reprints/pdfs/arcuser_extend-crime-analysis.pdf
Hutcheson GD. Ordinary Least-Squares Regression. In: Moutinho, L. and Hutcheson, G.D., The SAGE Dictionary of Quantitative Management Research, SAGE Publications, Thousand Oaks. 2011; 224-8. [DOI:10.4135/9781446251119.n67]
ESRI. Regression analysis tutorial for ArcGIS 10. ESRI Press; 2017.
Goodchild MF. What problem? Spatial autocorrelation and geographic information science. 1998; 1-11. http://www.geog.ucsb.edu/~good/papers/479.pdf
Mitchell A. The ESRI guide to GIS analysis: Spatial measurements and statistics. Vol. 2. Redlands: ESRI Press; 2005.
Brunsdon C, Fotheringham AS, Charlton ME. Geographically weighted regression: a method for exploring spatial non stationarity. Geographical Analysis. 1996; 28(4):281-98. [DOI:10.1111/j.1538-4632.1996.tb00936.x]
Pickle LW. Spatial Analysis of Disease. In: Biostatistical Applications in Cancer Research. vol. 113. Boston, MA: Springer; 2002. [DOI:10.1007/978-1-4757-3571-0_7]
Dickin SK, Schuster-Wallace CJ, Elliott SJ. Developing a vulnerability mapping methodology: Applying the water-associated disease index to dengue in Malaysia. PLoS One. 2013; 8(5):e63584. [DOI:10.1371/journal.pone.0063584] [PMID] [PMCID]
Neill, D.B. Detection of spatial and spatio-temporal clusters. Tech. Rep. CMU-CS-06-142. [Ph.D. Thesis]. Pittsburgh, PA: Carnegie Mellon University; 2006.
Miller JA. Species distribution models Spatial autocorrelation and non-stationarity. Progress in Physical Geography. 2012; 36:681-92. [DOI:10.1177/0309133312442522]
Grant WB, Lahore H, McDonnell SL, Baggerly CA, French CB, Aliano JL, et al. Evidence that vitamin D supplementation could reduce risk of Influenza and COVID-19 Infections and Deaths. Nutrients. 2020; 12(4):988. [DOI:10.3390/nu12040988] [PMID] [PMCID]
Condon D. Vitamin D could have key role in COVID-19 response. Irishhealth [Internet]. [Nov 01, 2020]. Available from: http://www.irishhealth.com/article.html?id=27110
Foley R, Charlton MC, Fotheringham AS. GIS in health and social care planning. In: Handbook of Theoretical and Quantitative Geography, UNIL-FGSE-Workshop series (2). Lausanne: Univ.de Lausanne- Faculté des géosciences et de l’environnement. 2009; 73-115. http://mural.maynoothuniversity.ie/2990/1/FoleyCharltonFotheringham_Final.pdf
Fotheringham AS. Geographically weighted regression. In: The SAGE Hand Book o Spatial Analysis. London: Sage Publications; 2009.
Type of Study: Case Report |
Subject:
Special
Received: 2020/03/10 | Accepted: 2020/03/23 | Published: 2020/04/1
Received: 2020/03/10 | Accepted: 2020/03/23 | Published: 2020/04/1
| Rights and permissions | |
 |
This work is licensed under a Creative Commons Attribution-NonCommercial 4.0 International License. |
Contact Information
Health in Emergencies and Disasters Quarterly
Health in Emergencies & Disasters Research Center, University of Social Welfare and Rehabilitation Sciences, Evin, Kudakyar Ave, Tehran, Iran.
Journal Tel: +9821 71732816 (2816)
Publisher Tel: +9821 4535 5555 - 4535 5000
