

Volume 11, Issue 3 (Spring 2026)
Health in Emergencies and Disasters Quarterly 2026, 11(3): 219-232 |
Back to browse issues page




Download citation:
BibTeX | RIS | EndNote | Medlars | ProCite | Reference Manager | RefWorks
Send citation to:


BibTeX | RIS | EndNote | Medlars | ProCite | Reference Manager | RefWorks
Send citation to:
Deyrmajaei A, Akbary M, Hejazizadeh Z, Saligheh M. Evaluation of the Impacts of Extreme Temperature Trends on Adverse Health Outcomes in Tehran City, Iran. Health in Emergencies and Disasters Quarterly 2026; 11 (3) :219-232
URL: http://hdq.uswr.ac.ir/article-1-670-en.html
URL: http://hdq.uswr.ac.ir/article-1-670-en.html


1- Department of Physical Geography, Faculty of Geographical Sciences, Kharazmi University, Tehran, Iran.
2- Department of Physical Geography, Faculty of Geographical Sciences, Kharazmi University, Tehran, Iran. ,mehryakbary@khu.ac.ir
2- Department of Physical Geography, Faculty of Geographical Sciences, Kharazmi University, Tehran, Iran. ,
Full-Text [PDF 941 kb]
(598 Downloads)
| Abstract (HTML) (1675 Views)
Full-Text: (100 Views)
Introduction
The emission of greenhouse gases caused by fossil fuels, especially carbon dioxide, leads to global warming. Therefore, according to the studies, the average temperature of the earth’s surface has increased by about 1 °C compared to the before industrial era. For this reason, the intergovernmental panel on climate change uses the element of average surface temperature before industrialization as a basis for evaluating global warming [1, 2]. By continuation of global warming, its impacts on humans and natural systems will increase, and global warming will become the most challenging problem for the world [3].
Global warming increases the intensity and frequency of extreme weather events [4, 5] and by affecting the climate system, it causes disturbance in the balance of nature and the climate change [6, 7]. These changes all over the world have negative effects on the physical and mental health of people [8, 9].
Currently, health is seen as an important priority to protect against the effects of climate change [10] because climate changes directly, such as exposure to freezing temperatures or drought, and indirectly, such as changes in the epidemiology of infectious diseases or changes in food quality, affect human health, and in both cases, the possibility of cardiovascular, respiratory, nervous and even premature death [11, 12]. In the meantime, the role of extreme temperatures is very important because it directly increases thermal [13].
Cities are an important area for discussing climate change issues because more than half of the world’s population lives in cities and the denser the population of a city, the more vulnerable it is to the consequences of climate change. It is very important that climate change is accelerating, but structural adjustment in cities is slow [14, 15]. Cities, especially Asian cities, are always at the forefront of the impacts of climate change [16].
Global warming and climate change on the one hand and topography and weather stability on the other hand are the main issues of the occurrence of climate hazards in Tehran City, Iran [17, 18].
Despite the importance of the issue of the effect of climate change on human health, less research has been conducted in this field, compared to other consequences. In order to check the background of the research, some studies in this field will be mentioned in the following, and then the purpose, hypothesis, and necessity of conducting the research will be explained.
Yao-Dong et al. studied the impact of climate change on human health in southern China. The results showed that the possible increase of severe heat waves will increase diseases and deaths, or the increase of continuous cold days will pose a risk to human health [19].
In their research, Carlarne and Depledge, while emphasizing the “human right to health,” criticized the lack of infrastructure and approach to deal with the relationship between climate change, human health, and human rights [20]. Ashrafuzzaman and Furini studied climate change and its effects on human health in the southwest coastal region of Bangladesh and believe one of the challenges of climate change and health is related to access to water for human and health purposes and disease that can be transmitted through water [21].
Liu et al. examined the relationship between temperature anomaly and mortality in the USA. Using statistical methods, they have found that 68% of deaths in their studied areas are related to abnormal heat [22].
Rizmie et al. investigated the effect of freezing temperature on emergency hospitalization in UK hospitals for the years 2000 to 2012. They found that the effect of cold extreme temperature is greater than of hot extreme temperature on hospital admissions [23]. Chen examined the climate change and its effects on human health in China and the results showed that extreme temperatures aggravate the severity of diseases and increase the duration of the hospitalization [24].
Farajzadeh et al. evaluated the effect of climate parameters on mortality in Tehran. They concluded that the effect of temperature on mortality amount is greater than of precipitation, and the relationship between cardiovascular disease and temperature is more than other diseases [25].
The study of the effect of climate change and dust on respiratory diseases in Ahvaz City, Iran has been implemented by Ataei and Heidari and has been determined that from 1988 to 2016, the incidence of the diseases was lower in the wet years, but higher in drought years [26].
Mohammad Salehi et al. investigated the trend of cholera disease and the effect of rainfall on the outbreak of this disease from 2005 to 2014. The results have shown that with the increase in rainfall, the probability of an epidemic occurring in the year after the occurrence increases [27].
Hajizadeh et al. generally, classified the diseases affected by global climate change in the form of 10 disease groups. These diseases are as follows: 1) Asthma, allergies and respiratory diseases; 2) cancers; 3) cardiovascular diseases; 4) food poisonings; 5) infectious and transmitted from insects; 6) mental problems; 7) brain disorders; 8) water-related diseases; 9) human development; and 10) heat-related mortality [28].
Rezaei Ghaleh et al. did some research in Qazvin City, Iran. Their results showed a significant inverse relationship between per capita green-blue infrastructure and the number of calls with emergency services in cardiovascular diseases, stroke, and respiratory diseases [29].
The studies implemented so far, have more examined the impacts of climate change. They have dealt with the role of climate on health and disease, and not fully covered all regions. However, it is necessary to act locally while having a global perspective. Studying the weather conditions require accurate studies since their changes are different from one place to another. Tehran is the most populous metropolis of Iran with a high population density. It is one of the relatively warm and semi-arid cities in the world, and very vulnerable to the consequences of climate change. So far, no research has been done with data processing and accurate monitoring of information related to temperature conditions and hospital referrals for Tehran.
This research evaluated the temperature changes and the occurrence of heat and cold waves in the last three decades and the consequences of these changes on human health in Tehran. Studying the past is the key to the future and a better understanding of the previous conditions paves the way for future planning to reduce vulnerability and achieve sustainable development. The hypothesis of the research states that the trend of temperature and frequency of heat waves have changed and increased during the observation period and there is a direct relationship between the increase in temperature and the number of hospital referrals.
Materials and Methods
A quantitative approach was employed in this research, following a second data analysis method (secondary analysis). To achieve the research goals, first the relevant data were collected, processed, and then analyzed. These data are introduced in the Table 1.
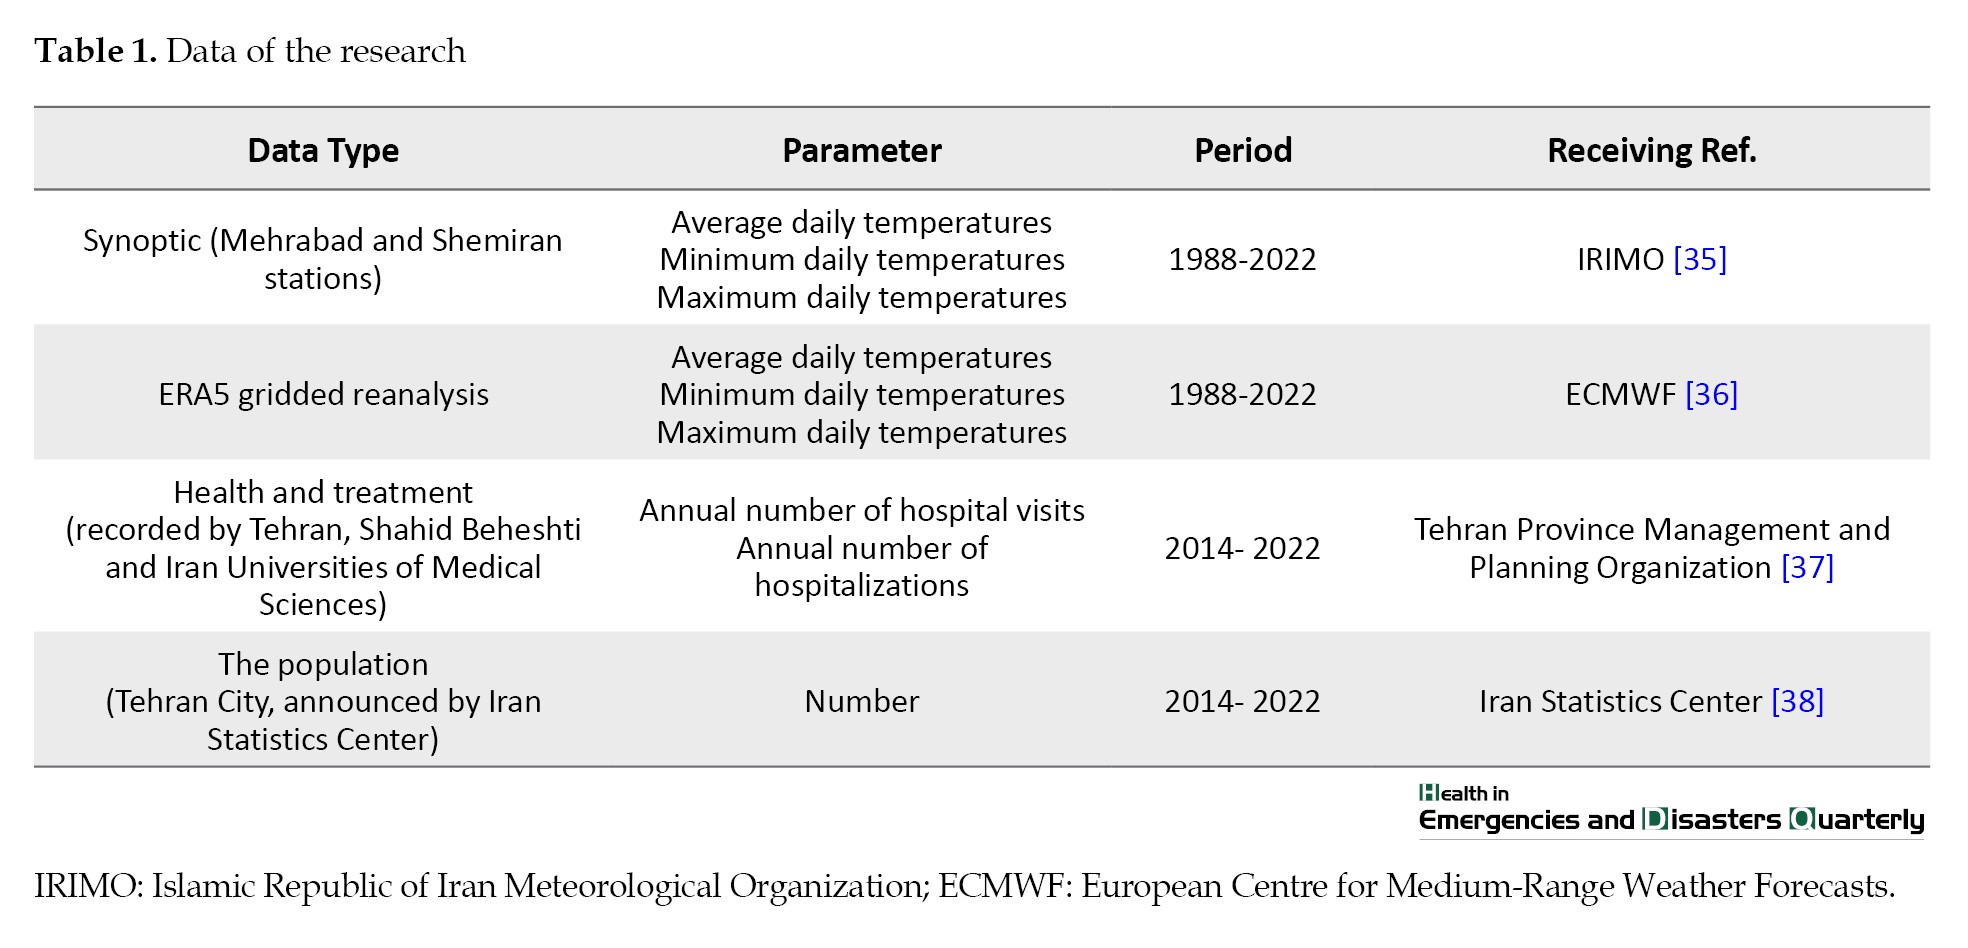
To evaluate the climatic conditions of this research and to study the trend of temperature changes in the observation period (1988-2022), two groups of data are considered: 1- synoptic station data, 2-ERA5 (fifth generation fifth generation the European Centre for Medium-Range Weather Forecasts [ECMWF] reanalysis) gridded data.
Mehrabad and Shemiran synoptic stations have been chosen because they have the appropriate data recording period in the time frame of the research. Due to limited number of synoptic stations, ERA5 data were received from the Copernicus base. The ERA5 hourly temperature data are available in gridded and reanalsis form. So, they can be checked and if they have a suitable output, they can be used in the next steps.
Therefore, two tangent points with the geographical coordinates of these two stations are among the gridde ERA5 data. After extraction, the validation indices were calculated for them. In order to ensure the proper accuracy of fifth generation ECMWF reanalysis (ERA5) data, these grid data were evaluated and validated based on station data with three indicators: mean absolute error (MAE), root mean square error (RMSE) and coefficient of determination (R2). The mentioned indicators result from Equations 1, 2 and 3:
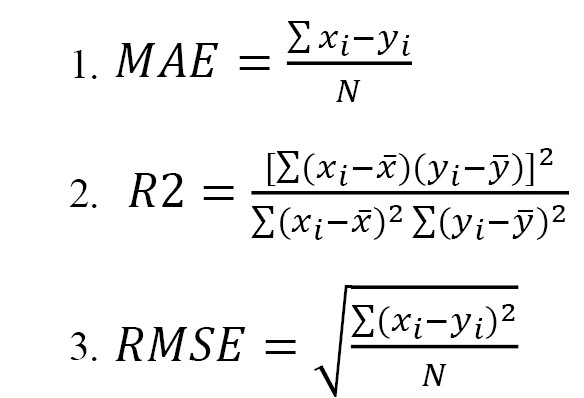
In the Equations 1, 2 and 3, xi is the observed data and yi is the simulated data; x and y are the average and N is the total number of samples.
Trend analysis is one of the most important measurements in the study of time series data. For this purpose, two general types of parametric and non-parametric tests are used in the analysis. Parametric tests require independence and normal distribution of the data, but in non-parametric tests, it is only necessary that the data be independent and tests can accept outliers in the data [30]. Therefore, examining how the temperature parameter changes, as well as health-related data was examined using non-parametric Mann-Kendall statistical test and relations 4 to 7 in Minitab software, version 21.4.2. In the last three decades, increasing public concern about environmental degradation has led to the general use of this non-parametric test [31].
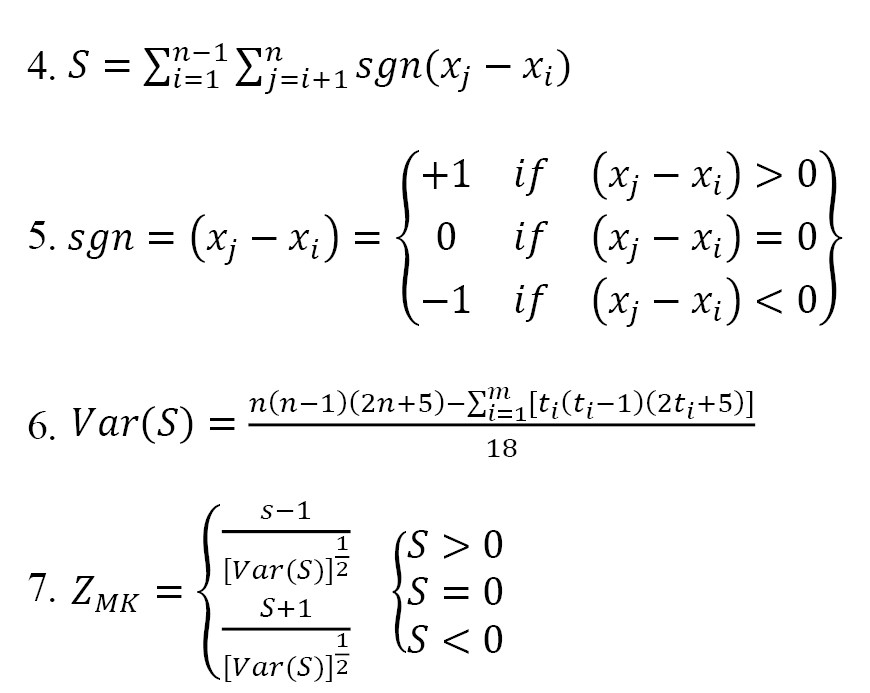
In the Equations 4, 5, 6 and 7, S is the difference between the values and n is the number of observations (data series) and xi, xj is the th data.
Var (S) is the variance of S and m is the number of series that have at least one identical data and t is the number of observed data and finally the Z is calculated through the Equation 7.
In the next step, to identify temperature trends and determine the occurrence of cold and heat waves during the research period, two adjusted periodic indices, i.e. cold spell duration index (CSDI) and warm spell duration index (WSDI) were used. These indices have been adjusted for the city of Tehran, and they examine the hot and the cold period continuity profile, respectively. To determine the hot period, the number of days in a year when the maximum temperature is greater than the 90th percentile for at least 3 consecutive days, and to determine the cold period, the number of days in the year when the minimum temperature is less than the 10th percentile for at least 3 consecutive days were considered. Therefore, the mentioned two indices determine the longest duration of each heat/cold wave event [32].
The hospital data considered in this research are the number of hospital visits and focusing on cardiovascular diseases and neurological and mental diseases. These data are available annually since 2014 (the authors of this article were able to get the mentioned data from the relevant sources until this research was conducted).
To achieve the goals of this research, it is imperative to first assess climatic conditions and subsequently calculate the correlation between element of temperature and the number of hospital visits. Previous studies conducted in other countries have substantiated the relationship between temperature and hospitalization rates through statistical analyses of relevant data. Both heat wave and temperature exposures can exert effects on Hospital admissions and diseases independently [33]. Therefore, by using the Pearson correlation coefficient (PCC), the correlation of these two groups of data will be calculated in SPSS software, version 26. The PCC is a statistical metric that measures the strength and direction of a linear relationship between two random variables. It has been applied to various indices in statistics, such as data analysis and classification, data analysis, clustering, decision making and biological research, and so on [34].
In continuation of previous research, a similar study using data process techniques should be conducted for Tehran City, as such research has not been conducted in Iran before. As mentioned in the introduction and the findings of previous researchers confirm the existence of a relationship and correlation between temperature conditions and the number of visits and hospitalizations, this point has been emphasized in the latest IPCC report.
Studied are
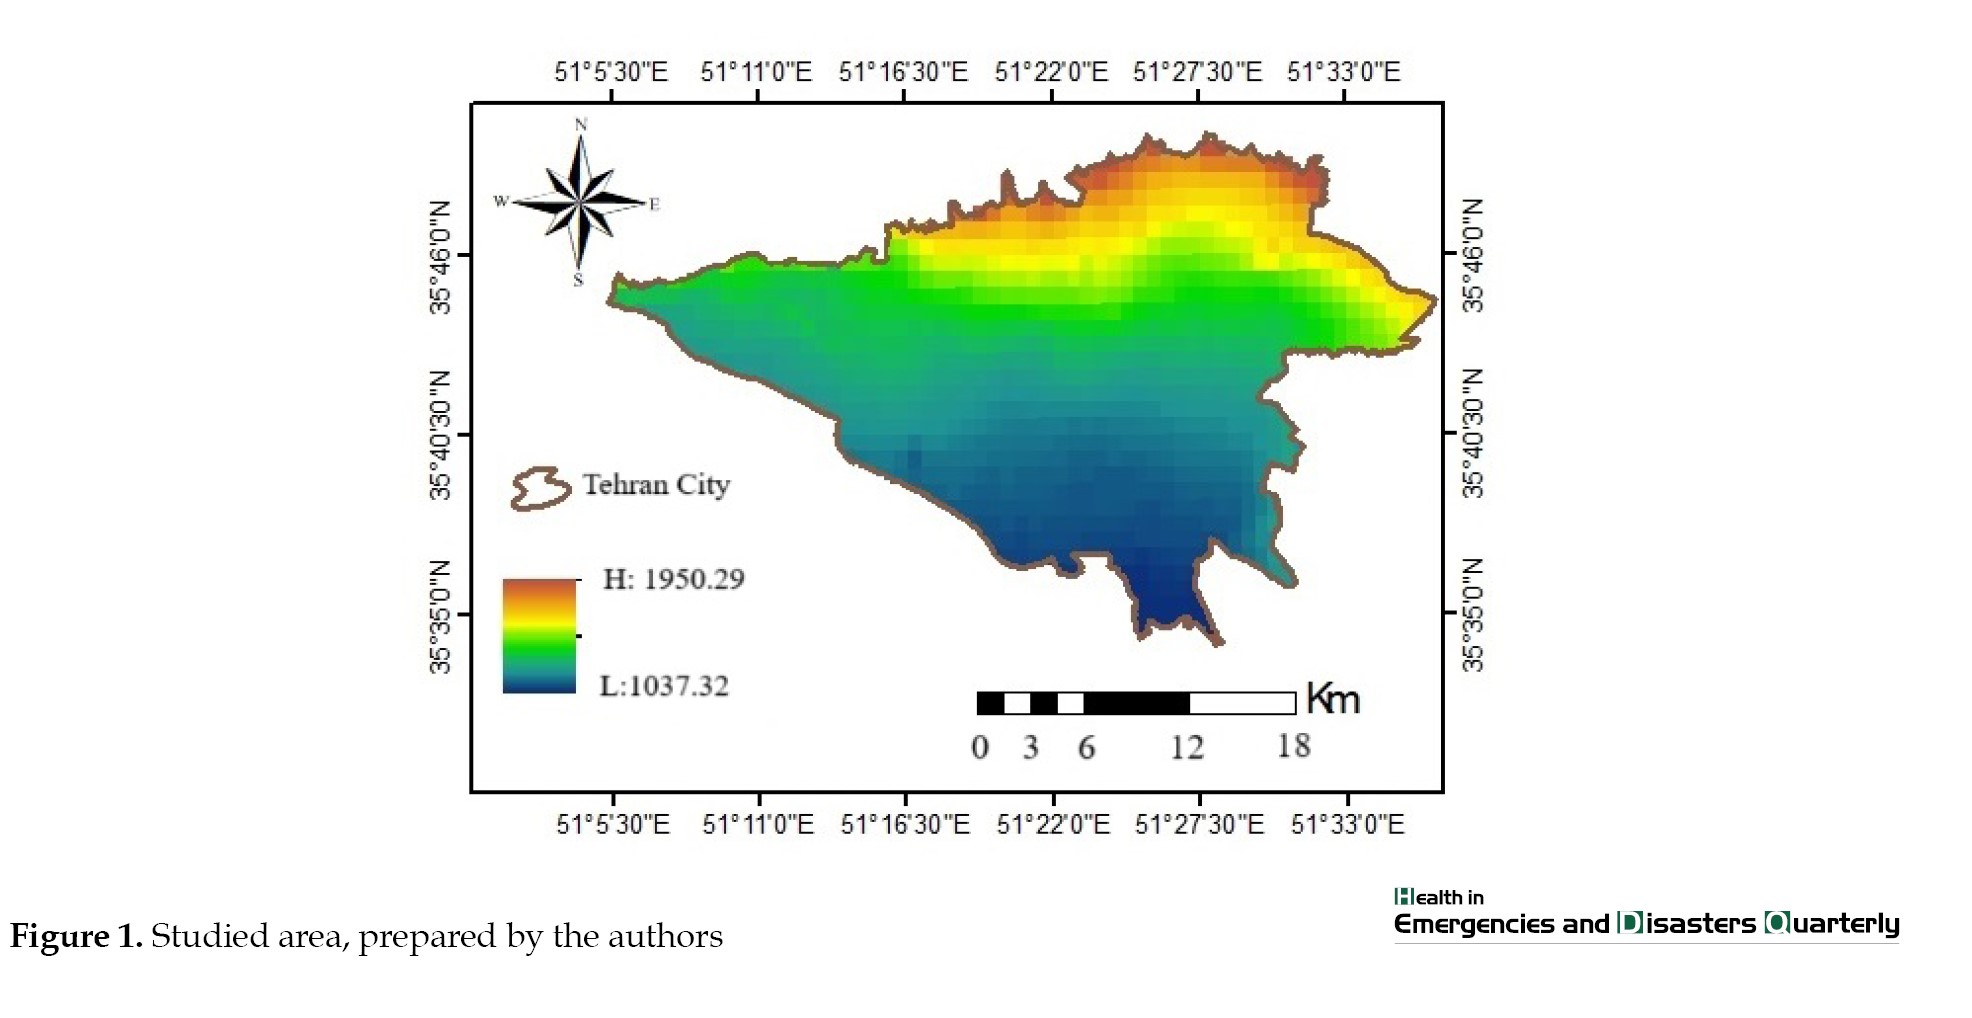
The studied area is in the capital of Iran. Iran has a wide variety of climates, from arid in central deserts to humid areas in Caspian shores. In Iran, from south to north and from east to west, the temperature decreases. The focus of this research is on the city of Tehran. In terms of climate, Tehran can be considered as a part of the inner foothills of Iran. In this area, winters are cold and wet while summers are hot and dry, and due to the irregular spatiotemporal distribution of rainfall in Tehran, some days it rains heavily [39]. In general, the city of Tehran has a moderate climate in the mountainous areas and a semi-arid in the plains [40]. In terms of topography, Tehran is located in the vicinity of the Alborz Mountain range and its southern slope [41]. Mountains and western winds have a positive role in Tehran’s climate, but their influence is not enough to neutralize the negative role of the desert [17]. Figure 1 shows the geographical location of the studied area.
 Tehran is the most populous city in Iran. In 2017 official census of the country, the population of Tehran was declared as 8693706 people, and for the year 2022, the population is estimated to be 8992000 people.
Results
Evaluation of ERA5 reanalysis data
ERA5 reanalysis data were evaluated after initial review and processing to ensure the accuracy of their production and usability in the next steps. The result of the validation indices for ERA5 data (1988-2022) is given in Table 2.
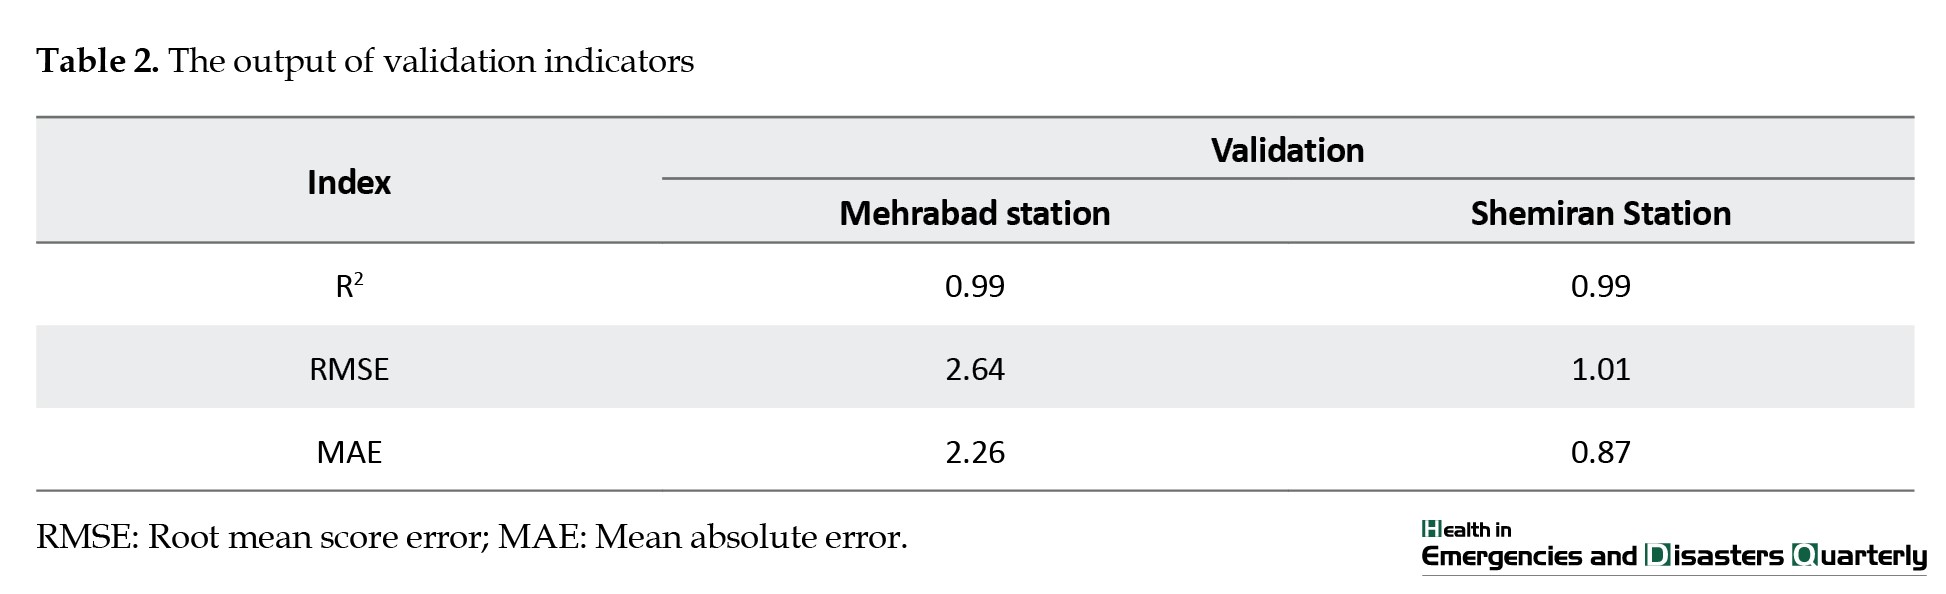
The average daily temperature values of the reanalysis ERA5 data were statistically compared and evaluated with the observed recorded data of Mehrabad and Shemiran synoptic stations. As seen in Table 2, the results of this evaluation indicated the proper performance, correlation, and high accuracy of ERA5 data.
The coefficient of determination value of more than 0.99 indicates a very favorable correlation of the reanalysis data with the station data.
The calculated error statistics indicate an average absolute error of less than 1 and a mean square of about 1 °C for the validated point with Shemiran station data, and both indicators are greater than 2 and less than 3 °C for Mehrabad station which provide a good accuracy of ERA5 data.
Therefore, the performance of these reanalyzed data was confirmed and used in the next stages of the research.
In the next step, after converting hourly to daily data, according to the 9-km resolution of ERA5 data, the values were compared and 4 non-repeating data groups were selected for study. These four groups each have common data in some areas of Tehran, which are as follows: 1) North, north-east, and north-west; 2) center, east, south, and southeast; 3) southwest; 4) west.
Analysis of temperature trend
The results of the Mann-Kendall non-parametric test in Minitab sowftware given in Table 3 show that the average monthly temperature in all areas of Tehran, during the period of 1988-2022 in the four months of June, July, Februrary, and March had significant increasing trend, with confidence and level of 99%.
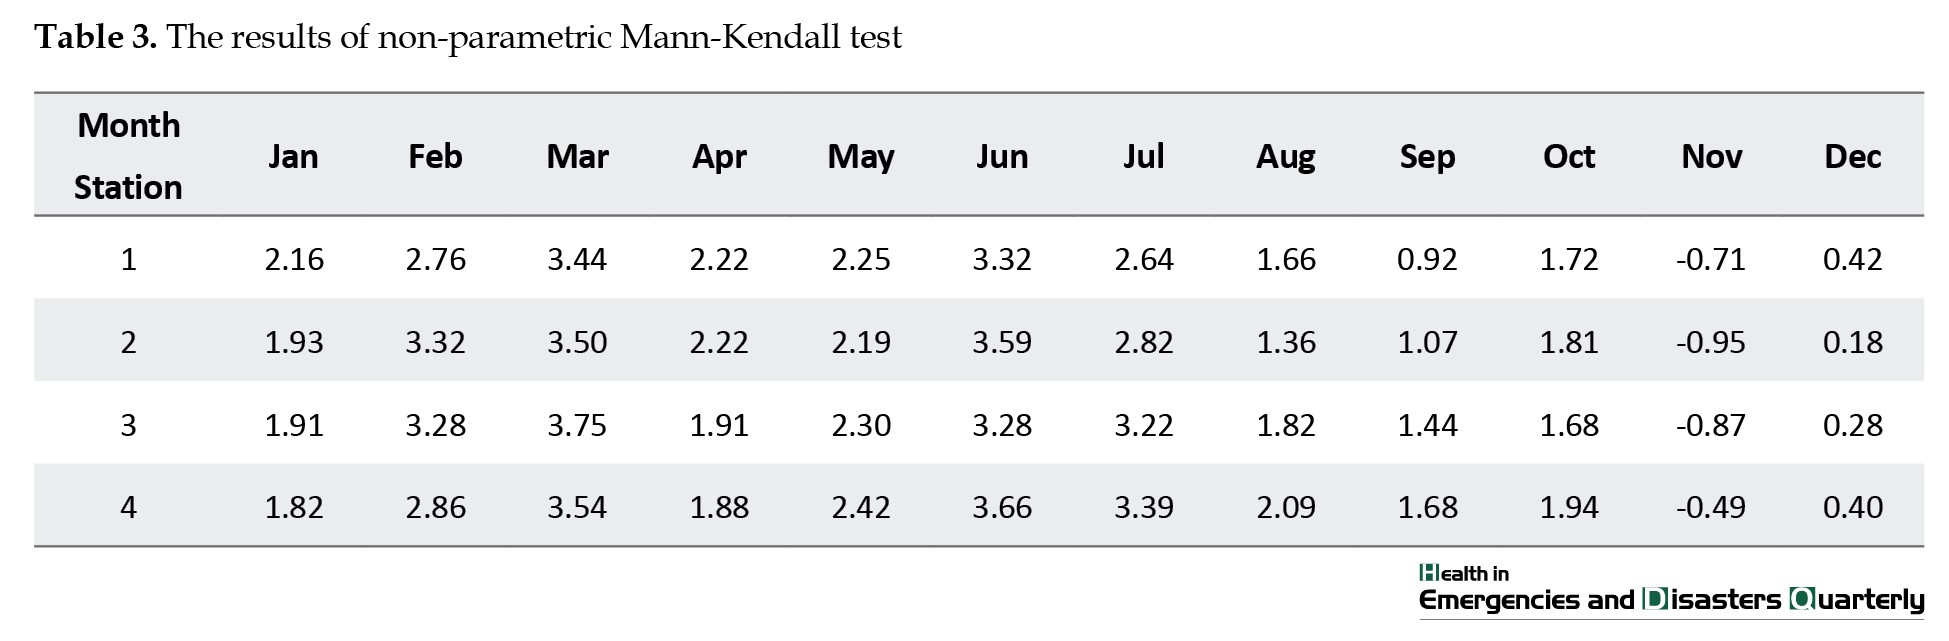
In other words, the average monthly temperature in two months of the hot seasons and two months of the cold seasons of the year, during the last 34 years in Tehran, has increased significantly with 99% confidence.
Also, the trend of the average monthly temperature in the months of April, May, and January has been also increasing and in most areas of Tehran, this trend has been significant with 95% confidence level.
In the studied time period (1988-2022), the average temperature of all areas of Tehran has increased except in November but this negative trend is not statistically significant. Although the other months of the year, namely August, September, October and December, have an increasing trend but the significance of these trends is not confirmed at the considered statistical levels.
To determine the years of occurrence of the lowest and highest average temperature of each month of the year and to determine the average monthly temperature records and also to draw the behavior of temperature in the studied years. Then, 34 under studied years were divided into two periods of 17 years, i.e. from 1988-2005 (the first period) and 2005-2022 (the second period) and were analyzed and compared.
The result of the investigation of the occurrence of the average temperature in all the studied years from 1988 to 2022, which is given in Table 4 shows that the lowest average monthly temperature is related to the years of the first study period and the seasons spring, summer and winter have had the lowest average temperature in the first study period, while the autumn season, especially the months of October and December, have had the highest average temperature in the last 34 years.
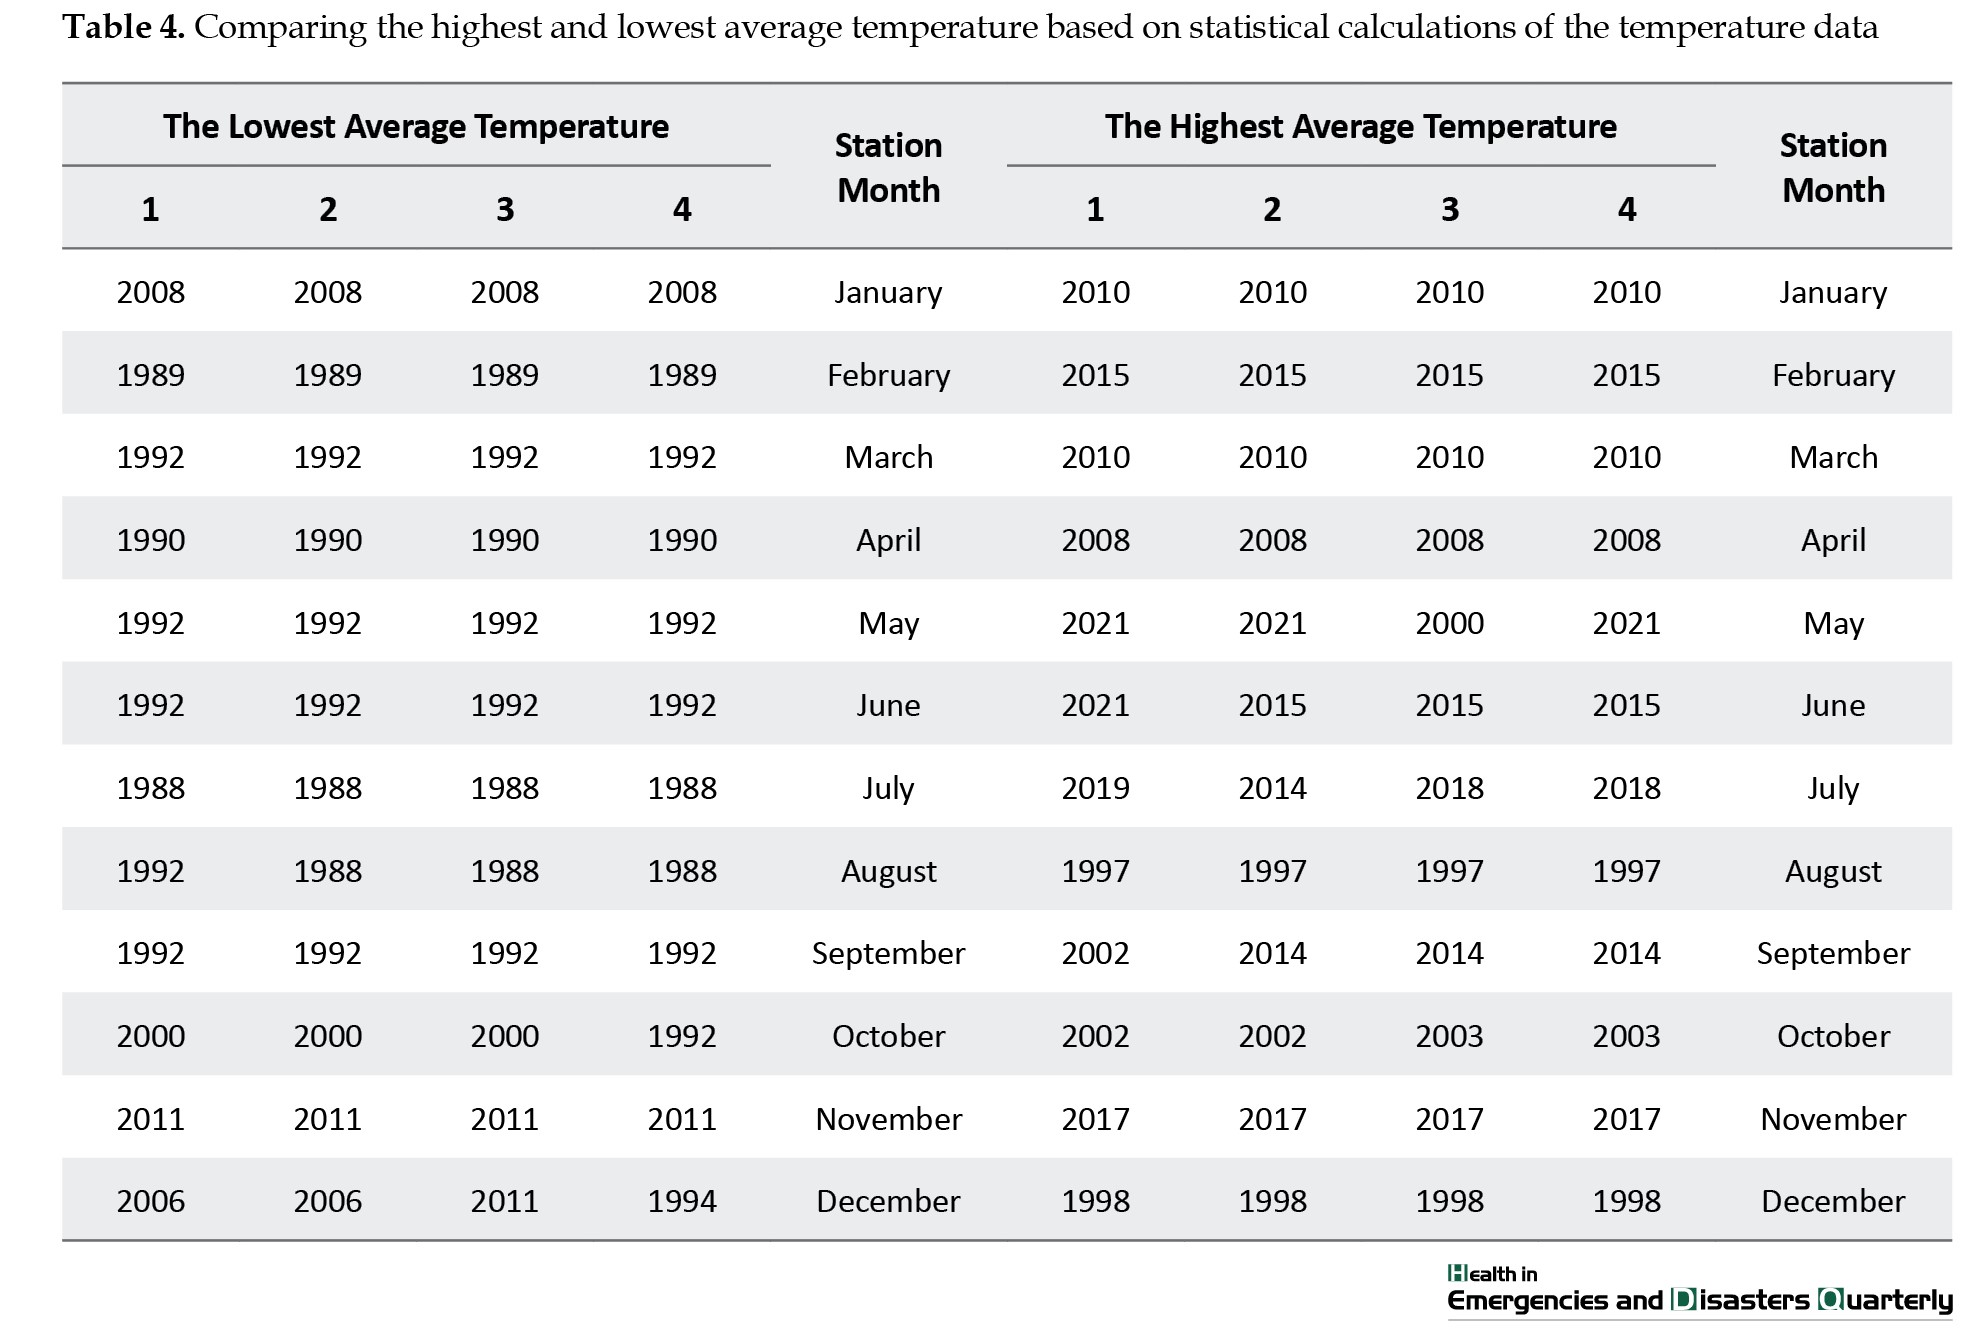
In the first studied period, the coldest months of the year did not record the highest temperature, but during the studied 34 years, in the second period, a warmer winter was experienced than in the first period.
The highest average temperature was recorded in spring, winter, September, and November in the second period.
Generally, the spring and summer season, the first month of autumn and the last two months of winter have the lowest temperature of 34 studies in the first period and in the second period under investigation, most of the months of the year, experienced the highest average temperature from 1988 to 2022. Therefore, the first period witnessed the minimum average temperature in most months of the year and the second period also witnessed the maximum average temperature in most months of the year compared to all 34 years.
Investigating the occurrence of heat waves and cold waves
In this stage, two indexes of WSDI and CSDI were used to extract and determine the days with heat or cold wave events. In the first step of this stage, the outputs of the above two indicators were calculated and then the frequency of occurrence of heat and cold waves in each year was checked. Next, the trend of changes in the number of annual waves was evaluated.
Figures 2 and 3 show the frequency of occurrence of the considered extremes and their trends during the studied time period.
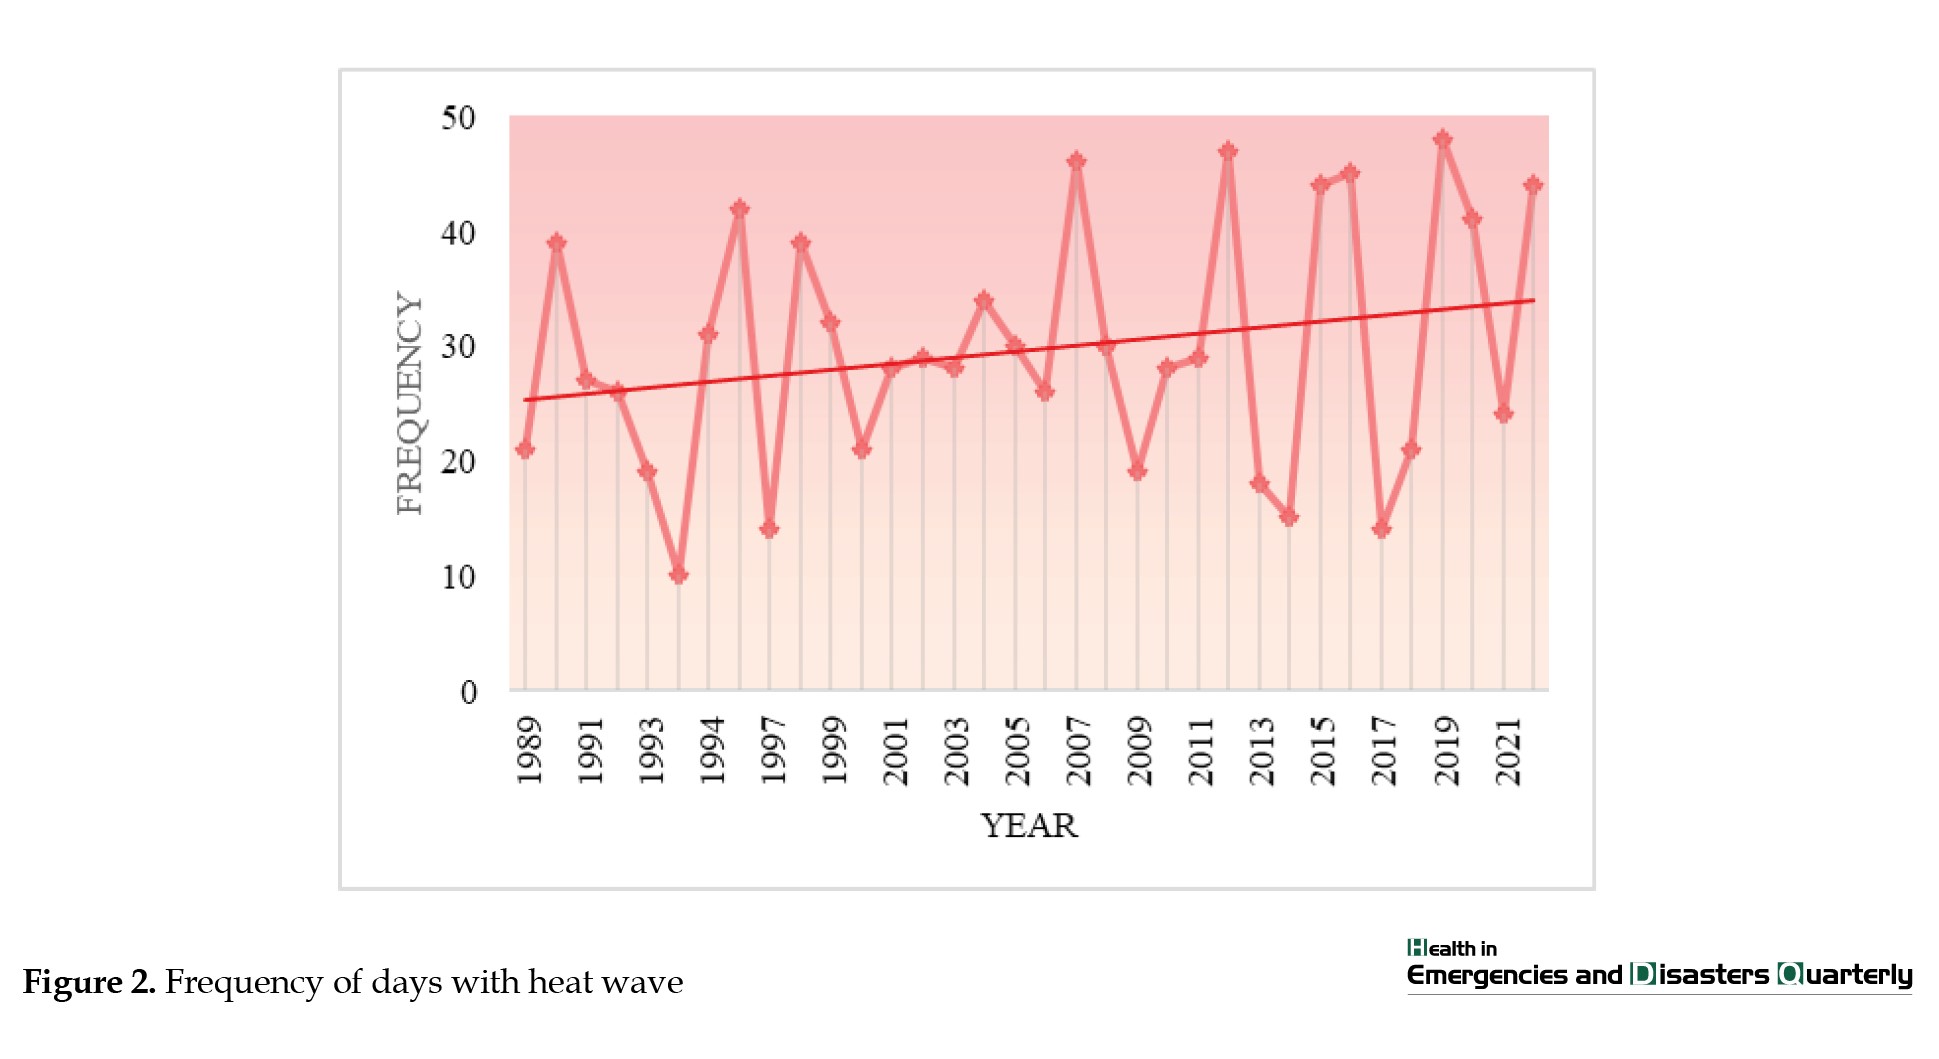
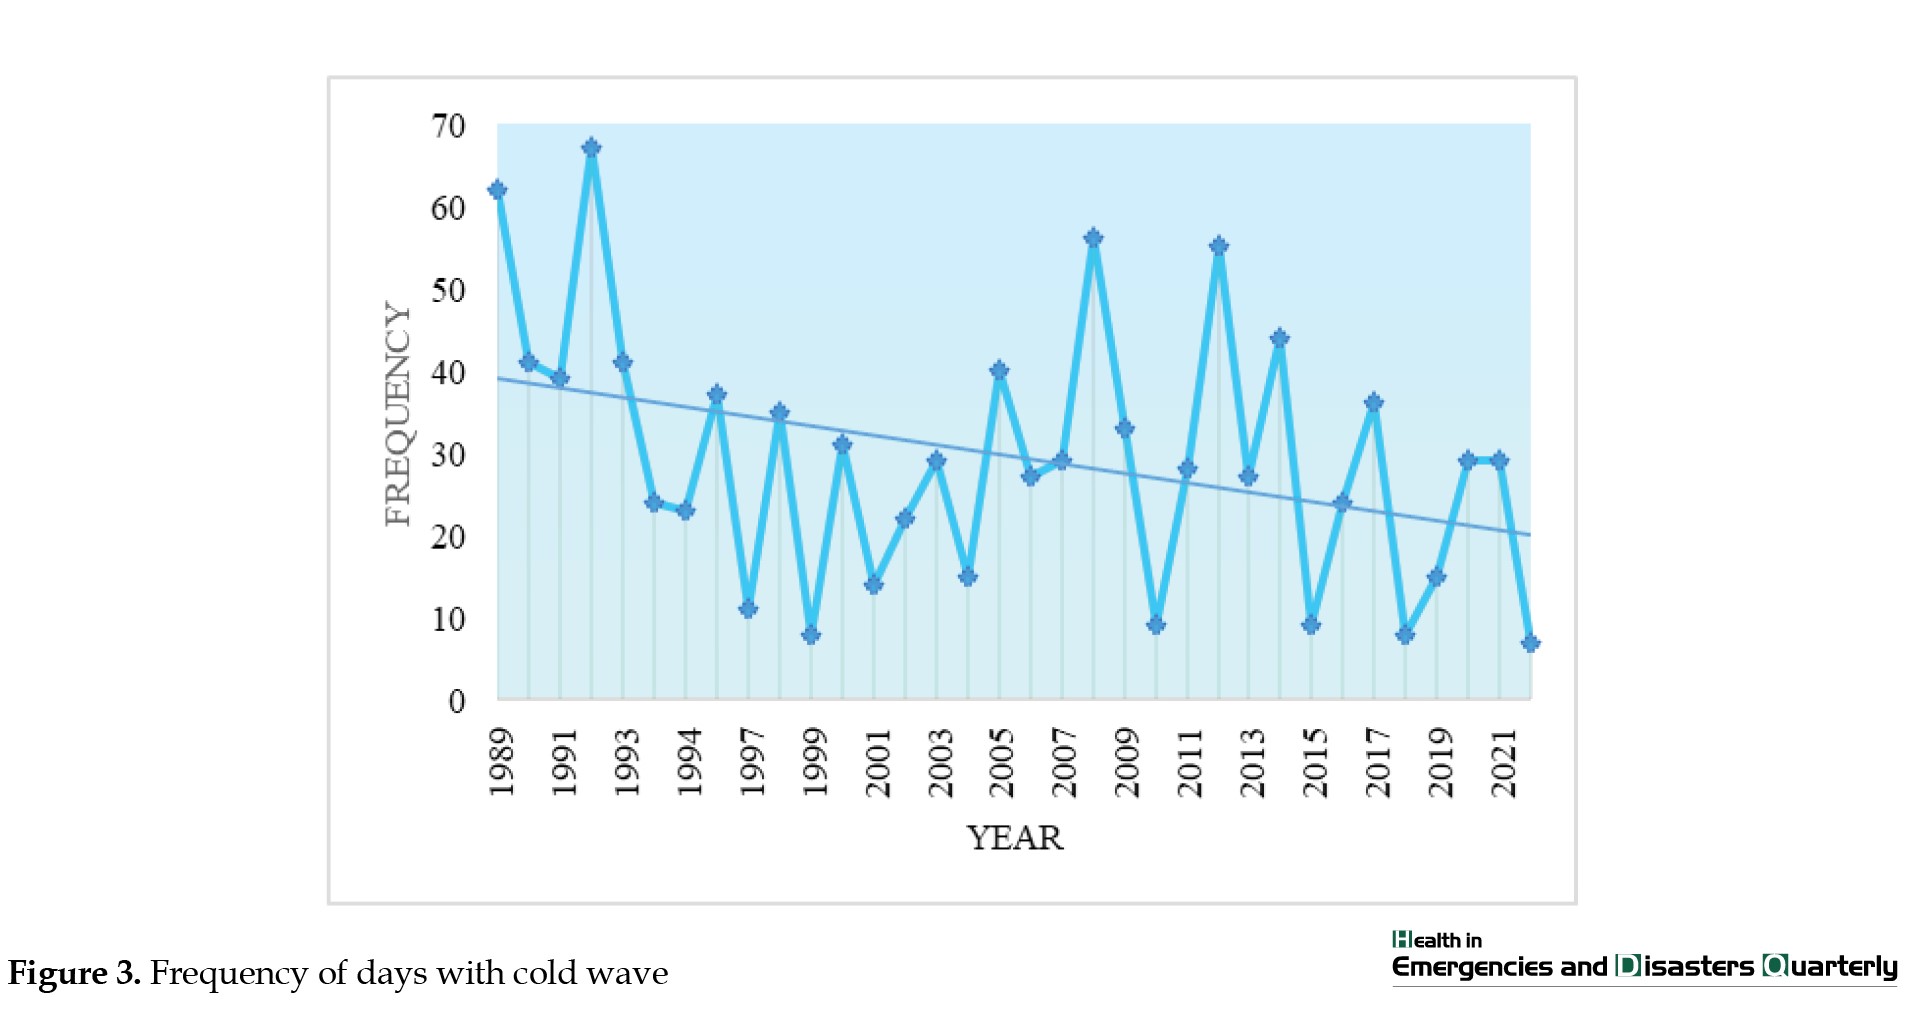 Also, the significancy of changes in frequency and average temperature of waves was evaluated. Considering the fluctuations and annual increases and decreases in the occurrence of temperature extremes, it was necessary to examine the trend of changes and their significance to capture a more appropriate view of the permanence of extreme temperatures in Tehran during the last 34 years. In this way, it was found that the occurrence of heat waves is increasing and the number of days accompanied by a heat wave with a duration of at least 3 consecutive days has increased, but it should be noted that the increasing trend of non-parametric Mann-Kendall statistical test, with an output of 1.08, is not significant.
Regarding the occurrence of cold waves, the conditions are different from heat waves, so that during the studied time, the number of days that were accompanied by a cold wave with a duration of at least 3 days, with a Z score of -2.08 (significant) is decreasing and the significance was confirmed at the 95% confidence level.
In addition to the frequency of days with cold or hot waves, the issue of temperature of waves is also very important, so the average temperature on the days of occurrence of these waves was calculated and then the trend of its changes was evaluated. The outputs showed that the average temperature during the duration of heat waves and cold waves, respectively, with a Z scores of 1.42 and 1.32, has had a positive but statistically insignificant trend.
Evaluating the relationship between disease rate with temperature and population growth
To reveal the effect of temperature on health and the occurrence of diseases during 2014-2022 in Tehran, the PCC between temperature and the number of hospital visits was calculated. With an output of 0.61, it was determined that the two parameters have a direct relationship and the intensity of the linear relationship. Also, the P value for this correlation was found 0.049, indicating a significant relationship between the average temperature and the number of hospital visits in the study period.
After proving the existence of a direct and positive relationship between these two parameters, the percentage growth of the population of Tehran and the average annual temperature were compared with the percentage growth of referrals and hospitalizations. The results of calculating the percentage of population growth showed that in 2022, the population of Tehran increased by 4.98% compared to 2014. While the amount of hospital visits in 2022 has grown by 16.42% compared to the 2013, the year with available data.
Available demographic data indicated an increasing change in the population of the 65 years and older age group in Tehran during 2016 to 2022, such that the population of this age group increased by 7.8% during the mentioned period.
Also, in a more detailed analysis, in the mentioned years, the number of hospital visits due to cardiovascular diseases increased by more than 310.4% and the number of visits due to neurological diseases increased by 55%. Therefore, it is clear that the increase in population is not the only reason for the increase in the incidence of health disorders and, as a result, other factors were effective in the increase in referrals to medical institutions.
It should be noted that the annual average temperature in the year 2022 increased by 2.11% compared to the average temperature in 2014.
Discussion
The general results of the present research show that the ERA5 reanalysis data for the temperature parameter in Tehran have high accuracy and good performance, the higher values of the validation indices for Mehrabad compared to Shemiran station, by double checking the data and the also higher temperature averages at this station is justifiable. So, they can provide an accurate alternative in areas without station data. This issue has been confirmed in the research studies of other researchers, such as Mohammadi Ghaleni and Sharafi [42], which have considered the accuracy of this database in the temperature variable suitable for different regions of Iran, or Gleixner et al. [43]. While confirming the efficiency of ERA5 data for East Africa, they pointed out the improvement of its performance compared to its previous generation, ERA-interim. Zhu et al. [44] also confirmed the performance of these data for Antarctica due to a strong linear relationship with monthly observations.
In the current research, the trend of long-term changes in the average monthly temperature from 1988 to 2022 was investigated and it was found that the average temperature had an increasing trend in all months of the year except for the November, and this trend during 7 months of the year has been significant with more than 95% confidence in the statistical levels.
The increasing trend in average temperature was particularly significant for the months of June, July, February, and March, with a 99% confidence level.
So, it can be admitted that during the studied time period, the average air temperature in spring, winter and July is significant increase in Tehran.
The decreasing trend in the average temperature of November could be attributed to local factors, although this decline was not statistically significant. In other words, despite some short-term fluctuations, the overall trend indicates a warming pattern in Tehran and this city have gradually become warmer during the past 34 years.
Generally, it can be concluded that the trend of long-term temperature changes in Tehran is increasing and leads to a warmer climate. The increase in temperature during the last few decades has been observed with various study methods in research studies [45-47], which confirm our results.
To achieve the goals of this research, the days of cold and heat waves during the 34 years were studied in Tehran with WSDI and CSDI indices, with the prerequisite of at least three days duration. It was revealed that the frequency of days of heat waves is increasing and on the other hand, the frequency of days accompanied by cold waves has been significantly decreasing.
Another important issue is the increase in the average temperature of both types of heat wave and cold wave. So that during these waves in Tehran, there has been an increasing trend in the average temperature of the wave. In other words, everything from the first year of the study has moved towards the last year of the study, hotter heat waves have been experienced, and the air temperature has also increased during the days of the cold wave. In another research [48], a result consistent with the findings of the current research has shown that in Iran, heat waves have become longer and cold waves have become shorter. Also, such results have been confirmed in some studies [49, 50]. Therefore, in recent decades, the trend of changing parameters temperature and the number of days with heat waves, as well as the average temperature were rising and the number of days with cold waves, have decreased.
Regarding the relationship between temperature parameters and human health conditions in Tehran, with the above calculations, it was found that there is a positive and direct correlation between the temperature parameter and the number of hospital visitors. During the years with health data, the number of referrals has been increasing from 2014 to 2022. To increase the accuracy of the study, the growth percentage of the population living in Tehran and the growth percentage of the number of hospital referrals were calculated and compared. The results showed that despite the population growth of 4.98%, the total number of hospital referrals increased by 16.42%, which is more significant in referrals due to neurological and mental diseases, especially cardiovascular diseases.
Therefore, it is clear that in addition to the increase in the population, other factors have also had an effect on the increase in the occurrence of health disorders, and what is important in the present discussion is the increase in temperature during this period of time and the increase in the number of days which accompanied by a heat wave and also an increase in the temperature of heat and cold waves. Therefore, due to the effect of temperature conditions on human health, this significant increase in the incidence of disease can be attributed to temperature changes in recent years in Tehran. Yazdanpanah et al. [51] confirmed the effect of the increasing trend of heat stress index on the rate of cardiovascular visits in Bandar Abbas City. Extreme high temperature appears to increase hospital admissions for cardiovascular and respiratory disorders in New York City [52]. Other international researchers, in similar studies, have also concluded that in Shanghai from January 2008 to December 2015, extreme hot temperature poses significant risks on hospital admissions for mental disorders [53]. During the six-year baseline period (2010-2015), there is a substantial temperature-attributable impact on hospital admissions and costs which are estimated to increase due to climate change and an increasing aged population in Adelaide, South Australia [54]. To examine associations between the daily number of hospital admissions and meteorological variables in Cyprus (2009-2018), regression was fitted. The results showed that the mean daily temperature was positively associated with hospital admissions from any cause [55]. Therefore, the hypothesis was confirmed within the framework of the research goals.
Conclusion
Using synoptic data from Mehrabad and Shemiran stations, as well as ERA5 reanalysis data for Tehran, temperature conditions and variations in temperature extremes were evaluated. The results revealed an increasing trend in monthly mean temperature, a higher frequency and intensity of heatwaves, and a decreasing frequency, but increasing intensity of cold wave during the period 1988-2022. Positive and direct correlation between temperature changes and the number of visits and hospitalizations was confirmed in Tehran during 2014-2022. Assessments have shown that one of the significant effecting factors on changes in the frequency of hospital admissions is the consequences of global warming and climate change. As a result, the hypothesis of this study was confirmed within the framework of the research objectives.
Therefore, the effect of temperature increases and higher thermal extremes on the higher number of hospital visits in Tehran is confirmed. So, it is necessary to take compulsory actions and appropriate planning to adapt and reduce damage to the physical and mental health of citizens in Tehran.
Despite the challenges of accessing hospital data, this study is the first quantitative research to assess temperature change, extreme temperature events, and their association with changes in hospital admissions in Tehran and considering the results obtained, this research can serve as a foundation for future research in this field.
Furthermore, the figures announced by the Statistical Center of Iran indicated an increase in the population of individuals over 65 years of age in Tehran from 2016 to 2021. Therefore, considering the greater vulnerability of the elderly population (those over 65 years), it is recommended that future research study the impact of climate change on various age groups, including the elderly and it is recommended that each disease associated with climate change be evaluated separately in future research. Additionally, as electronic health records in Tehran are relatively new and have only been maintained for less than two decades and would continue to be updated, future studies have the potential to more complete assessment of the impact of temperature changes on human health.
Ethical Considerations
Compliance with ethical guidelines
This study was approved by the Ethics Committee of Kharazmi University, Tehran, Iran (Code: IR.KHU.REC.1402.097).
Funding
This study was extracted from the PhD dissertation of Aida Deyrmajaei, approved by the Department of Physical Geography, Faculty of Geographical Sciences, Kharazmi University, Tehran, Iran.
Authors' contributions
All authors equally contributed to preparing this article.
Conflict of interest
The authors declared no conflict of interest.
Reference
The emission of greenhouse gases caused by fossil fuels, especially carbon dioxide, leads to global warming. Therefore, according to the studies, the average temperature of the earth’s surface has increased by about 1 °C compared to the before industrial era. For this reason, the intergovernmental panel on climate change uses the element of average surface temperature before industrialization as a basis for evaluating global warming [1, 2]. By continuation of global warming, its impacts on humans and natural systems will increase, and global warming will become the most challenging problem for the world [3].
Global warming increases the intensity and frequency of extreme weather events [4, 5] and by affecting the climate system, it causes disturbance in the balance of nature and the climate change [6, 7]. These changes all over the world have negative effects on the physical and mental health of people [8, 9].
Currently, health is seen as an important priority to protect against the effects of climate change [10] because climate changes directly, such as exposure to freezing temperatures or drought, and indirectly, such as changes in the epidemiology of infectious diseases or changes in food quality, affect human health, and in both cases, the possibility of cardiovascular, respiratory, nervous and even premature death [11, 12]. In the meantime, the role of extreme temperatures is very important because it directly increases thermal [13].
Cities are an important area for discussing climate change issues because more than half of the world’s population lives in cities and the denser the population of a city, the more vulnerable it is to the consequences of climate change. It is very important that climate change is accelerating, but structural adjustment in cities is slow [14, 15]. Cities, especially Asian cities, are always at the forefront of the impacts of climate change [16].
Global warming and climate change on the one hand and topography and weather stability on the other hand are the main issues of the occurrence of climate hazards in Tehran City, Iran [17, 18].
Despite the importance of the issue of the effect of climate change on human health, less research has been conducted in this field, compared to other consequences. In order to check the background of the research, some studies in this field will be mentioned in the following, and then the purpose, hypothesis, and necessity of conducting the research will be explained.
Yao-Dong et al. studied the impact of climate change on human health in southern China. The results showed that the possible increase of severe heat waves will increase diseases and deaths, or the increase of continuous cold days will pose a risk to human health [19].
In their research, Carlarne and Depledge, while emphasizing the “human right to health,” criticized the lack of infrastructure and approach to deal with the relationship between climate change, human health, and human rights [20]. Ashrafuzzaman and Furini studied climate change and its effects on human health in the southwest coastal region of Bangladesh and believe one of the challenges of climate change and health is related to access to water for human and health purposes and disease that can be transmitted through water [21].
Liu et al. examined the relationship between temperature anomaly and mortality in the USA. Using statistical methods, they have found that 68% of deaths in their studied areas are related to abnormal heat [22].
Rizmie et al. investigated the effect of freezing temperature on emergency hospitalization in UK hospitals for the years 2000 to 2012. They found that the effect of cold extreme temperature is greater than of hot extreme temperature on hospital admissions [23]. Chen examined the climate change and its effects on human health in China and the results showed that extreme temperatures aggravate the severity of diseases and increase the duration of the hospitalization [24].
Farajzadeh et al. evaluated the effect of climate parameters on mortality in Tehran. They concluded that the effect of temperature on mortality amount is greater than of precipitation, and the relationship between cardiovascular disease and temperature is more than other diseases [25].
The study of the effect of climate change and dust on respiratory diseases in Ahvaz City, Iran has been implemented by Ataei and Heidari and has been determined that from 1988 to 2016, the incidence of the diseases was lower in the wet years, but higher in drought years [26].
Mohammad Salehi et al. investigated the trend of cholera disease and the effect of rainfall on the outbreak of this disease from 2005 to 2014. The results have shown that with the increase in rainfall, the probability of an epidemic occurring in the year after the occurrence increases [27].
Hajizadeh et al. generally, classified the diseases affected by global climate change in the form of 10 disease groups. These diseases are as follows: 1) Asthma, allergies and respiratory diseases; 2) cancers; 3) cardiovascular diseases; 4) food poisonings; 5) infectious and transmitted from insects; 6) mental problems; 7) brain disorders; 8) water-related diseases; 9) human development; and 10) heat-related mortality [28].
Rezaei Ghaleh et al. did some research in Qazvin City, Iran. Their results showed a significant inverse relationship between per capita green-blue infrastructure and the number of calls with emergency services in cardiovascular diseases, stroke, and respiratory diseases [29].
The studies implemented so far, have more examined the impacts of climate change. They have dealt with the role of climate on health and disease, and not fully covered all regions. However, it is necessary to act locally while having a global perspective. Studying the weather conditions require accurate studies since their changes are different from one place to another. Tehran is the most populous metropolis of Iran with a high population density. It is one of the relatively warm and semi-arid cities in the world, and very vulnerable to the consequences of climate change. So far, no research has been done with data processing and accurate monitoring of information related to temperature conditions and hospital referrals for Tehran.
This research evaluated the temperature changes and the occurrence of heat and cold waves in the last three decades and the consequences of these changes on human health in Tehran. Studying the past is the key to the future and a better understanding of the previous conditions paves the way for future planning to reduce vulnerability and achieve sustainable development. The hypothesis of the research states that the trend of temperature and frequency of heat waves have changed and increased during the observation period and there is a direct relationship between the increase in temperature and the number of hospital referrals.
Materials and Methods
A quantitative approach was employed in this research, following a second data analysis method (secondary analysis). To achieve the research goals, first the relevant data were collected, processed, and then analyzed. These data are introduced in the Table 1.
To evaluate the climatic conditions of this research and to study the trend of temperature changes in the observation period (1988-2022), two groups of data are considered: 1- synoptic station data, 2-ERA5 (fifth generation fifth generation the European Centre for Medium-Range Weather Forecasts [ECMWF] reanalysis) gridded data.
Mehrabad and Shemiran synoptic stations have been chosen because they have the appropriate data recording period in the time frame of the research. Due to limited number of synoptic stations, ERA5 data were received from the Copernicus base. The ERA5 hourly temperature data are available in gridded and reanalsis form. So, they can be checked and if they have a suitable output, they can be used in the next steps.
Therefore, two tangent points with the geographical coordinates of these two stations are among the gridde ERA5 data. After extraction, the validation indices were calculated for them. In order to ensure the proper accuracy of fifth generation ECMWF reanalysis (ERA5) data, these grid data were evaluated and validated based on station data with three indicators: mean absolute error (MAE), root mean square error (RMSE) and coefficient of determination (R2). The mentioned indicators result from Equations 1, 2 and 3:
In the Equations 1, 2 and 3, xi is the observed data and yi is the simulated data; x and y are the average and N is the total number of samples.
Trend analysis is one of the most important measurements in the study of time series data. For this purpose, two general types of parametric and non-parametric tests are used in the analysis. Parametric tests require independence and normal distribution of the data, but in non-parametric tests, it is only necessary that the data be independent and tests can accept outliers in the data [30]. Therefore, examining how the temperature parameter changes, as well as health-related data was examined using non-parametric Mann-Kendall statistical test and relations 4 to 7 in Minitab software, version 21.4.2. In the last three decades, increasing public concern about environmental degradation has led to the general use of this non-parametric test [31].
In the Equations 4, 5, 6 and 7, S is the difference between the values and n is the number of observations (data series) and xi, xj is the th data.
Var (S) is the variance of S and m is the number of series that have at least one identical data and t is the number of observed data and finally the Z is calculated through the Equation 7.
In the next step, to identify temperature trends and determine the occurrence of cold and heat waves during the research period, two adjusted periodic indices, i.e. cold spell duration index (CSDI) and warm spell duration index (WSDI) were used. These indices have been adjusted for the city of Tehran, and they examine the hot and the cold period continuity profile, respectively. To determine the hot period, the number of days in a year when the maximum temperature is greater than the 90th percentile for at least 3 consecutive days, and to determine the cold period, the number of days in the year when the minimum temperature is less than the 10th percentile for at least 3 consecutive days were considered. Therefore, the mentioned two indices determine the longest duration of each heat/cold wave event [32].
The hospital data considered in this research are the number of hospital visits and focusing on cardiovascular diseases and neurological and mental diseases. These data are available annually since 2014 (the authors of this article were able to get the mentioned data from the relevant sources until this research was conducted).
To achieve the goals of this research, it is imperative to first assess climatic conditions and subsequently calculate the correlation between element of temperature and the number of hospital visits. Previous studies conducted in other countries have substantiated the relationship between temperature and hospitalization rates through statistical analyses of relevant data. Both heat wave and temperature exposures can exert effects on Hospital admissions and diseases independently [33]. Therefore, by using the Pearson correlation coefficient (PCC), the correlation of these two groups of data will be calculated in SPSS software, version 26. The PCC is a statistical metric that measures the strength and direction of a linear relationship between two random variables. It has been applied to various indices in statistics, such as data analysis and classification, data analysis, clustering, decision making and biological research, and so on [34].
In continuation of previous research, a similar study using data process techniques should be conducted for Tehran City, as such research has not been conducted in Iran before. As mentioned in the introduction and the findings of previous researchers confirm the existence of a relationship and correlation between temperature conditions and the number of visits and hospitalizations, this point has been emphasized in the latest IPCC report.
Studied are
The studied area is in the capital of Iran. Iran has a wide variety of climates, from arid in central deserts to humid areas in Caspian shores. In Iran, from south to north and from east to west, the temperature decreases. The focus of this research is on the city of Tehran. In terms of climate, Tehran can be considered as a part of the inner foothills of Iran. In this area, winters are cold and wet while summers are hot and dry, and due to the irregular spatiotemporal distribution of rainfall in Tehran, some days it rains heavily [39]. In general, the city of Tehran has a moderate climate in the mountainous areas and a semi-arid in the plains [40]. In terms of topography, Tehran is located in the vicinity of the Alborz Mountain range and its southern slope [41]. Mountains and western winds have a positive role in Tehran’s climate, but their influence is not enough to neutralize the negative role of the desert [17]. Figure 1 shows the geographical location of the studied area.
Results
Evaluation of ERA5 reanalysis data
ERA5 reanalysis data were evaluated after initial review and processing to ensure the accuracy of their production and usability in the next steps. The result of the validation indices for ERA5 data (1988-2022) is given in Table 2.
The average daily temperature values of the reanalysis ERA5 data were statistically compared and evaluated with the observed recorded data of Mehrabad and Shemiran synoptic stations. As seen in Table 2, the results of this evaluation indicated the proper performance, correlation, and high accuracy of ERA5 data.
The coefficient of determination value of more than 0.99 indicates a very favorable correlation of the reanalysis data with the station data.
The calculated error statistics indicate an average absolute error of less than 1 and a mean square of about 1 °C for the validated point with Shemiran station data, and both indicators are greater than 2 and less than 3 °C for Mehrabad station which provide a good accuracy of ERA5 data.
Therefore, the performance of these reanalyzed data was confirmed and used in the next stages of the research.
In the next step, after converting hourly to daily data, according to the 9-km resolution of ERA5 data, the values were compared and 4 non-repeating data groups were selected for study. These four groups each have common data in some areas of Tehran, which are as follows: 1) North, north-east, and north-west; 2) center, east, south, and southeast; 3) southwest; 4) west.
Analysis of temperature trend
The results of the Mann-Kendall non-parametric test in Minitab sowftware given in Table 3 show that the average monthly temperature in all areas of Tehran, during the period of 1988-2022 in the four months of June, July, Februrary, and March had significant increasing trend, with confidence and level of 99%.
In other words, the average monthly temperature in two months of the hot seasons and two months of the cold seasons of the year, during the last 34 years in Tehran, has increased significantly with 99% confidence.
Also, the trend of the average monthly temperature in the months of April, May, and January has been also increasing and in most areas of Tehran, this trend has been significant with 95% confidence level.
In the studied time period (1988-2022), the average temperature of all areas of Tehran has increased except in November but this negative trend is not statistically significant. Although the other months of the year, namely August, September, October and December, have an increasing trend but the significance of these trends is not confirmed at the considered statistical levels.
To determine the years of occurrence of the lowest and highest average temperature of each month of the year and to determine the average monthly temperature records and also to draw the behavior of temperature in the studied years. Then, 34 under studied years were divided into two periods of 17 years, i.e. from 1988-2005 (the first period) and 2005-2022 (the second period) and were analyzed and compared.
The result of the investigation of the occurrence of the average temperature in all the studied years from 1988 to 2022, which is given in Table 4 shows that the lowest average monthly temperature is related to the years of the first study period and the seasons spring, summer and winter have had the lowest average temperature in the first study period, while the autumn season, especially the months of October and December, have had the highest average temperature in the last 34 years.
In the first studied period, the coldest months of the year did not record the highest temperature, but during the studied 34 years, in the second period, a warmer winter was experienced than in the first period.
The highest average temperature was recorded in spring, winter, September, and November in the second period.
Generally, the spring and summer season, the first month of autumn and the last two months of winter have the lowest temperature of 34 studies in the first period and in the second period under investigation, most of the months of the year, experienced the highest average temperature from 1988 to 2022. Therefore, the first period witnessed the minimum average temperature in most months of the year and the second period also witnessed the maximum average temperature in most months of the year compared to all 34 years.
Investigating the occurrence of heat waves and cold waves
In this stage, two indexes of WSDI and CSDI were used to extract and determine the days with heat or cold wave events. In the first step of this stage, the outputs of the above two indicators were calculated and then the frequency of occurrence of heat and cold waves in each year was checked. Next, the trend of changes in the number of annual waves was evaluated.
Figures 2 and 3 show the frequency of occurrence of the considered extremes and their trends during the studied time period.
Regarding the occurrence of cold waves, the conditions are different from heat waves, so that during the studied time, the number of days that were accompanied by a cold wave with a duration of at least 3 days, with a Z score of -2.08 (significant) is decreasing and the significance was confirmed at the 95% confidence level.
In addition to the frequency of days with cold or hot waves, the issue of temperature of waves is also very important, so the average temperature on the days of occurrence of these waves was calculated and then the trend of its changes was evaluated. The outputs showed that the average temperature during the duration of heat waves and cold waves, respectively, with a Z scores of 1.42 and 1.32, has had a positive but statistically insignificant trend.
Evaluating the relationship between disease rate with temperature and population growth
To reveal the effect of temperature on health and the occurrence of diseases during 2014-2022 in Tehran, the PCC between temperature and the number of hospital visits was calculated. With an output of 0.61, it was determined that the two parameters have a direct relationship and the intensity of the linear relationship. Also, the P value for this correlation was found 0.049, indicating a significant relationship between the average temperature and the number of hospital visits in the study period.
After proving the existence of a direct and positive relationship between these two parameters, the percentage growth of the population of Tehran and the average annual temperature were compared with the percentage growth of referrals and hospitalizations. The results of calculating the percentage of population growth showed that in 2022, the population of Tehran increased by 4.98% compared to 2014. While the amount of hospital visits in 2022 has grown by 16.42% compared to the 2013, the year with available data.
Available demographic data indicated an increasing change in the population of the 65 years and older age group in Tehran during 2016 to 2022, such that the population of this age group increased by 7.8% during the mentioned period.
Also, in a more detailed analysis, in the mentioned years, the number of hospital visits due to cardiovascular diseases increased by more than 310.4% and the number of visits due to neurological diseases increased by 55%. Therefore, it is clear that the increase in population is not the only reason for the increase in the incidence of health disorders and, as a result, other factors were effective in the increase in referrals to medical institutions.
It should be noted that the annual average temperature in the year 2022 increased by 2.11% compared to the average temperature in 2014.
Discussion
The general results of the present research show that the ERA5 reanalysis data for the temperature parameter in Tehran have high accuracy and good performance, the higher values of the validation indices for Mehrabad compared to Shemiran station, by double checking the data and the also higher temperature averages at this station is justifiable. So, they can provide an accurate alternative in areas without station data. This issue has been confirmed in the research studies of other researchers, such as Mohammadi Ghaleni and Sharafi [42], which have considered the accuracy of this database in the temperature variable suitable for different regions of Iran, or Gleixner et al. [43]. While confirming the efficiency of ERA5 data for East Africa, they pointed out the improvement of its performance compared to its previous generation, ERA-interim. Zhu et al. [44] also confirmed the performance of these data for Antarctica due to a strong linear relationship with monthly observations.
In the current research, the trend of long-term changes in the average monthly temperature from 1988 to 2022 was investigated and it was found that the average temperature had an increasing trend in all months of the year except for the November, and this trend during 7 months of the year has been significant with more than 95% confidence in the statistical levels.
The increasing trend in average temperature was particularly significant for the months of June, July, February, and March, with a 99% confidence level.
So, it can be admitted that during the studied time period, the average air temperature in spring, winter and July is significant increase in Tehran.
The decreasing trend in the average temperature of November could be attributed to local factors, although this decline was not statistically significant. In other words, despite some short-term fluctuations, the overall trend indicates a warming pattern in Tehran and this city have gradually become warmer during the past 34 years.
Generally, it can be concluded that the trend of long-term temperature changes in Tehran is increasing and leads to a warmer climate. The increase in temperature during the last few decades has been observed with various study methods in research studies [45-47], which confirm our results.
To achieve the goals of this research, the days of cold and heat waves during the 34 years were studied in Tehran with WSDI and CSDI indices, with the prerequisite of at least three days duration. It was revealed that the frequency of days of heat waves is increasing and on the other hand, the frequency of days accompanied by cold waves has been significantly decreasing.
Another important issue is the increase in the average temperature of both types of heat wave and cold wave. So that during these waves in Tehran, there has been an increasing trend in the average temperature of the wave. In other words, everything from the first year of the study has moved towards the last year of the study, hotter heat waves have been experienced, and the air temperature has also increased during the days of the cold wave. In another research [48], a result consistent with the findings of the current research has shown that in Iran, heat waves have become longer and cold waves have become shorter. Also, such results have been confirmed in some studies [49, 50]. Therefore, in recent decades, the trend of changing parameters temperature and the number of days with heat waves, as well as the average temperature were rising and the number of days with cold waves, have decreased.
Regarding the relationship between temperature parameters and human health conditions in Tehran, with the above calculations, it was found that there is a positive and direct correlation between the temperature parameter and the number of hospital visitors. During the years with health data, the number of referrals has been increasing from 2014 to 2022. To increase the accuracy of the study, the growth percentage of the population living in Tehran and the growth percentage of the number of hospital referrals were calculated and compared. The results showed that despite the population growth of 4.98%, the total number of hospital referrals increased by 16.42%, which is more significant in referrals due to neurological and mental diseases, especially cardiovascular diseases.
Therefore, it is clear that in addition to the increase in the population, other factors have also had an effect on the increase in the occurrence of health disorders, and what is important in the present discussion is the increase in temperature during this period of time and the increase in the number of days which accompanied by a heat wave and also an increase in the temperature of heat and cold waves. Therefore, due to the effect of temperature conditions on human health, this significant increase in the incidence of disease can be attributed to temperature changes in recent years in Tehran. Yazdanpanah et al. [51] confirmed the effect of the increasing trend of heat stress index on the rate of cardiovascular visits in Bandar Abbas City. Extreme high temperature appears to increase hospital admissions for cardiovascular and respiratory disorders in New York City [52]. Other international researchers, in similar studies, have also concluded that in Shanghai from January 2008 to December 2015, extreme hot temperature poses significant risks on hospital admissions for mental disorders [53]. During the six-year baseline period (2010-2015), there is a substantial temperature-attributable impact on hospital admissions and costs which are estimated to increase due to climate change and an increasing aged population in Adelaide, South Australia [54]. To examine associations between the daily number of hospital admissions and meteorological variables in Cyprus (2009-2018), regression was fitted. The results showed that the mean daily temperature was positively associated with hospital admissions from any cause [55]. Therefore, the hypothesis was confirmed within the framework of the research goals.
Conclusion
Using synoptic data from Mehrabad and Shemiran stations, as well as ERA5 reanalysis data for Tehran, temperature conditions and variations in temperature extremes were evaluated. The results revealed an increasing trend in monthly mean temperature, a higher frequency and intensity of heatwaves, and a decreasing frequency, but increasing intensity of cold wave during the period 1988-2022. Positive and direct correlation between temperature changes and the number of visits and hospitalizations was confirmed in Tehran during 2014-2022. Assessments have shown that one of the significant effecting factors on changes in the frequency of hospital admissions is the consequences of global warming and climate change. As a result, the hypothesis of this study was confirmed within the framework of the research objectives.
Therefore, the effect of temperature increases and higher thermal extremes on the higher number of hospital visits in Tehran is confirmed. So, it is necessary to take compulsory actions and appropriate planning to adapt and reduce damage to the physical and mental health of citizens in Tehran.
Despite the challenges of accessing hospital data, this study is the first quantitative research to assess temperature change, extreme temperature events, and their association with changes in hospital admissions in Tehran and considering the results obtained, this research can serve as a foundation for future research in this field.
Furthermore, the figures announced by the Statistical Center of Iran indicated an increase in the population of individuals over 65 years of age in Tehran from 2016 to 2021. Therefore, considering the greater vulnerability of the elderly population (those over 65 years), it is recommended that future research study the impact of climate change on various age groups, including the elderly and it is recommended that each disease associated with climate change be evaluated separately in future research. Additionally, as electronic health records in Tehran are relatively new and have only been maintained for less than two decades and would continue to be updated, future studies have the potential to more complete assessment of the impact of temperature changes on human health.
Ethical Considerations
Compliance with ethical guidelines
This study was approved by the Ethics Committee of Kharazmi University, Tehran, Iran (Code: IR.KHU.REC.1402.097).
Funding
This study was extracted from the PhD dissertation of Aida Deyrmajaei, approved by the Department of Physical Geography, Faculty of Geographical Sciences, Kharazmi University, Tehran, Iran.
Authors' contributions
All authors equally contributed to preparing this article.
Conflict of interest
The authors declared no conflict of interest.
Reference
- Malhi GS, Kaur M, Kaushik P. Impact of climate change on agriculture and its mitigation strategies: A review. Sustainability. 2021; 13(3):1318. [DOI:10.3390/su13031318]
- Ameur HB, Han X, Liu Z, Peillex J. When did global warming start? A new baseline for carbon budgeting. Economic Modelling. 2022; 116:106005. [DOI:10.1016/j.econmod.2022.106005]
- Sun Y, Hu T, Zhang X, Li C, Lu C, Ren G, et al. Contribution of global warming and urbanization to changes in temperature extremes in Eastern China. Geophysical Research Letters. 2019; 46(20):11426-34. [DOI:10.1029/2019GL084281]
- Forzieri G, Cescatti A, e Silva FB, Feyen L. Increasing risk over time of weather-related hazards to the European population: A data-driven prognostic study. The Lancet Planetary Health. 2017; 1(5):e200-8. [DOI:10.1016/S2542-5196(17)30082-7] [PMID]
- Lee JY, Kim H. Comprehensive assessment of climate change risks. The Lancet Planetary Health. 2017; 1(5):e166-7. [DOI:10.1016/S2542-5196(17)30084-0] [PMID]
- Bakirci K, Kirtiloglu Y. Effect of climate change to solar energy potential: a case study in the Eastern Anatolia region of Turkey. Environmental Science and Pollution Research. 2022; 29:2839-52. [DOI:10.1007/s11356-021-14681-0] [PMID]
- Zhao Q, Yu P, Mahendran R, Huang W, Gao Y, Yang Z, et al. Global climate change and human health: Pathways and possible solutions. Eco-Environment & Health. 2022; 1(2):53-62. [DOI:10.1016/j.eehl.2022.04.004] [PMID]
- Pörtner HO, Roberts DC, Tignor M, Poloczanska E, Mintenbeck K, Alegría A, et al. IPPC 2022: Climate change 2022: impacts, adaptation and vulnerability: Working group II contribution to the sith assessment report of the intergovernmental panel on climate change. 2022. [DOI:10.1017/9781009325844]
- Cianconi P, Betrò S, Janiri L. The impact of climate change on mental health: A systematic descriptive review. Frontiers in psychiatry. 2020; 11:490206. [DOI:10.3389/fpsyt.2020.00074] [PMID]
- Thomson MC, Mason SJ. Climate information for public health action [M.Kamangar & M. Akbary, Persian trans.] Tehran: Jihad Daneshgahi, Tehran Medical Sciences Branch; 2022. [Link]
- Neira M, Erguler K, Ahmady-Birgani H, Al-Hmoud ND, Fears R, Gogos C, et al. Climate change and human health in the Eastern Mediterranean and Middle East: Literature review, research priorities and policy suggestions. Environmental research. 2023; 216(Part 2):114537. [DOI:10.1016/j.envres.2022.114537] [PMID]
- Junquera AB. Paying lip service to health: An analysis of health in climate change mitigation policies in Spain. The Journal of Climate Change and Health. 2022; 6:100128. [DOI:10.1016/j.joclim.2022.100128]
- Lee JY, Choi H, Kim H. Dependence of future mortality changes on global CO2 concentrations: A review. Environment International. 2018; 114:52-9. [DOI:10.1016/j.envint.2018.02.024] [PMID]
- Yuan J, Lin Q, Chen S, Zhao H, Xie X, Cai Z, et al. Influence of global warming and urbanization on regional climate of Megacity: A case study of Chengdu, China. Urban Climate. 2022; 44:101227. [DOI:10.1016/j.uclim.2022.101227]
- Short JR, Farmer A. Cities and climate change. Earth. 2021; 2(4):1038-45. [DOI:10.3390/earth2040061]
- Dulal HB. Cities in Asia: how are they adapting to climate change? Journal of Environmental Studies and Sciences. 2019; 9:13-24. [DOI:10.1007/s13412-018-0534-1]
- Saligheh M. [Climate change and climate hazards in Tehran (Persian)]. Journal of Spatial Analysis Environmental Hazards. 2015; 2(3):15-32. [DOI:10.18869/acadpub.jsaeh.2.3.15]
- Ramezani N, Alijani B, Borna R. [Explaining the effects of climate elements in Tehran’s metropolis air quality (Persian)]. Geographical Researches Quarterly Journal. 2018; 33(3):154-69. [DOI:10.29252/geores.33.3.154]
- Yao-Dong D, Xian-Wei W, Xiao-Feng Y, Wen-Jun M, Hui A, Xiao-Xuan W. Impacts of climate change on human health and adaptation strategies in South China. Advances in Climate Change Research. 2013; 4(4):208-14. [DOI:10.3724/SP.J.1248.2013.208]
- Carlarne C, Depledge MH. Climate change, environmental health, and human rights. In: Newman S, editor. Reference module in earth systems and environmental sciences encyclopedia of environmental health. 2th ed. Amsterdam: Elsevier; 2019. [Link]
- Ashrafuzzaman M, Furini GL. Climate change and human health linkages in the context of globalization: An overview from global to southwestern coastal region of Bangladesh. Environment international. 2019; 127:402-11. [DOI:10.1016/j.envint.2019.03.020] [PMID]
- Liu H, Tong M, Guo F, Nie Q, Li J, Li P, et al. Deaths attributable to anomalous temperature: A generalizable metric for the health impact of global warming. Environment International. 2022; 169:107520. [DOI:10.1016/j.envint.2022.107520] [PMID]
- Rizmie D, de Preux L, Miraldo M, Atun R. Impact of extreme temperatures on emergency hospital admissions by age and socio-economic deprivation in England. Social Science & Medicine. 2022; 308:115193. [DOI:10.1016/j.socscimed.2022.115193] [PMID]
- Chen F, Zhang X, Chen Z. Behind climate change: Extreme heat and health cost. Structural Change and Economic Dynamics. 2023; 64:101-10. [DOI:10.1016/j.strueco.2022.12.007]
- Farajzadeh Asl M, Darand M, Faghih Zadeh S. [Communication between climatic parameters and the mortality of the population of Tehran (Persian)]. The Journal of Spatial Planning and Geomatics. 2010; 14(2):290-302. [Link]
- Ataei H, Heidari M. [Investigating the effect of climate change and dust on respiratory diseases (case study: Ahvaz city) (Persian)]. Biological and Biotechnology Studies. 2017; 3(2):1-10. [Link]
- Mohammadsalehi N, Holakouie Naieni K, Eshrati B, Mohammadbeigi A, Ahmadnezhad E, Arsangjang S. [Trend of Cholera in the last 50 years and modeling the effect of annual temperature and rainfall on incidence of new outbreaks in Iran (2005-2014) (Persian)]. Iranian Journal of Epidemiology. 2018; 14(1):1-8. [Link]
- Hajizadeh M, Ramezani M, Hossein Shahibandari M. [Investigating the effects of climate change on human health (Persian)]. Journal of Environmental Studies, Natural Resources and Sustainable Development. 2019; 3(9):1-6. [Link]
- Rezaei Ghaleh M, Hagh Parast F, Maleki A. Investigating the correlation between blue-green infrastructure and reduction of heat-related health effect under climate change (case study: Qazvin city). Bagh-e Nazar. 2022; 19(107):79-94. [DOI:10.22034/bagh.2021.273770.4810]
- Hussain M, Mahmud I. pyMannKendall: A python package for non parametric Mann Kendall family of trend tests. Journal of Open Source Software. 2019; 4(39):1556. [DOI:10.21105/joss.01556]
- Yue S, Wang CY. Applicability of prewhitening to eliminate the influence of serial correlation on the Mann-Kendall test. Water Resources Research. 2002; 38(6):4-7. [DOI:10.1029/2001WR000861]
- Wilcke RAI, Kjellström E, Lin C, Matei D, Moberg A, Tyrlis E. The extremely warm summer of 2018 in Sweden-set in a historical context. Earth System Dynamics. 2020; 11(4):1107-21. [DOI:10.5194/esd-11-1107-2020]
- Sherbakov T, Malig B, Guirguis K, Gershunov A, Basu R. Ambient temperature and added heat wave effects on hospitalizations in California from 1999 to 2009. Environmental research. 2018; 160:83-90. [DOI:10.1016/j.envres.2017.08.052] [PMID]
- Zhou H, Deng Z, Xia Y, Fu M. A new sampling method in particle filter based on Pearson correlation coefficient. Neurocomputing. 2016; 216:208-15. [DOI:10.1016/j.neucom.2016.07.036]
- [I.R. of Iran meteorogicat organization (Persian)] [Internet]. Available from: [Link]
- ECMWF: European Centre for Medium-Range Weather Forecasts [Internet]. Available from: [Link]
- [Tehran Province Management and Planning Organization (Persian)] [Internet]. Available from: [Link]
- [Iran Statistics Center (Persian)] [Internet]. Available from: [Link]
- Alijani B. [Climate of Iran (Persian)]. 11th ed. Tehran: Payam-e-Noor Publication; 2012. [Link]
- Alijani B, Razavi ZS. [Comparing the different climatic indices in assessing the comfort condition of Tehran urban area (Persian)]. Geographic Thought. 2017; 8(16):145-69. [Link]
- Akbary M, Kermani A, Alijani B. Simulation and analysis of polluted days in Tehran. International Journal of Environmental Research. 2018; 12:67-75. [DOI:10.1007/s41742-018-0069-z]
- Mohammadi Ghaleni M, Sharafi S. [Evaluation of CRU TS4.05 and ERA5 datasets accuracy to precipitation, temperature and potential evapotranspiration in different climates across Iran (Persian)]. Iranian Journal of Irrigation & Drainage. 2022; 16(5):879-90. [Link]
- Gleixner S, Demissie T, Diro GT. Did ERA5 improve temperature and precipitation reanalysis over East Africa? Atmosphere. 2020; 11(9):996. [DOI:10.3390/atmos11090996]
- Zhu J, Xie A, Qin X, Wang Y, Xu B, Wang Y. An assessment of ERA5 reanalysis for Antarctic near-surface air temperature. Atmosphere. 2021; 12(2):217. [DOI:10.3390/atmos12020217]
- Binesh N, Niksokhan MH, Sarang A. [Trend detection in Tehran temperature and precipitation during 1984-2014 (Persian)]. Nivar. 2017; 41(96-97):23-32. [DOI:10.30467/nivar.2017.45153]
- Halabian AH, Helforosh Salmasi A. [The modeling and prediction of annual mean temperature changes in Tehran (Persian)]. Environmental Researches. 2019; 9(18):101-12. [Link]
- Jamali FS, Khaledi S. [The role of temperature changes in environmental sustainability of Tehran (Persian)]. Journal of Earth Science Researches. 2021; 12(45):222-35. [DOI:10.52547/esrj.12.1.222]
- Darand M. [Assessment and detection of climate change in Iran during recent decades (Persian)]. Iranian Jornal of Watershed Management Science & Engineering. 2015; 9(30):1-14. [Link]
- Hosseini SA, Marofi S, Shahraki N, Mohamadi M. [The duration of days with heat waves in different climates using Markov chain (Persian)]. Journal of Soil and Water Knowledge. 2019; 29(2):157-70. [Link]
- Ranjbar F, Moghbel M. [The effect of urban expansion on climate conditions of Mehrabad synoptic station (Persian)]. Physical Geography Research. 2019; 51(2):245-62. [DOI:10.22059/jphgr.2019.265823.1007276]
- Yazdanpanah H, Salehifard O, Golshahi J. [The effect of heat waves on cardiovascular patients (case study: Bandar Abbas) (Persian)]. Spatial Planning. 2015; 5(3):45-62. [Link]
- Lin S, Luo M, Walker RJ, Liu X, Hwang SA, Chinery R. Extreme high temperatures and hospital admissions for respiratory and cardiovascular diseases. Epidemiology. 2009; 20(5):738-46. [DOI:10.1097/ede.0b013e3181ad5522] [PMID]
- Peng Z, Wang Q, Kan H, Chen R, Wang W. Effects of ambient temperature on daily hospital admissions for mental disorders in Shanghai, China: a time-series analysis. Science of the Total Environment. 2017; 590-1:281-6. [DOI:10.1016/j.scitotenv.2017.02.237] [PMID]
- Wondmagegn BY, Xiang J, Dear K, Williams S, Hansen A, Pisaniello D, et al. Increasing impacts of temperature on hospital admissions, length of stay, and related healthcare costs in the context of climate change in Adelaide, South Australia. Science of the total Environment. 2021; 773:145656. [DOI:10.1016/j.scitotenv.2021.145656] [PMID]
- Pantavou K, Giallouros G, Philippopoulos K, Piovani D, Cartalis C, Bonovas S, et al. Thermal conditions and hospital admissions: Analysis of longitudinal data from Cyprus (2009-2018). International Journal of Environmental Research and Public Health. 2021; 18(24):13361. [DOI:10.3390/ijerph182413361] [PMID]
Type of article: Research |
Subject:
General
Received: 2024/10/17 | Accepted: 2025/09/6 | Published: 2026/04/1
Received: 2024/10/17 | Accepted: 2025/09/6 | Published: 2026/04/1
Send email to the article author
| Rights and permissions | |
 |
This work is licensed under a Creative Commons Attribution-NonCommercial 4.0 International License. |

Copyright © The Author(s);
This is an open access article distributed under the terms of the Creative Commons Attribution-NonCommercial 4.0 (CC-By-NC 4.0), which permits use, distribution, and reproduction in any medium, provided the original work is properly cited and is not used for commercial purposes.
Contact Information
This is an open access article distributed under the terms of the Creative Commons Attribution-NonCommercial 4.0 (CC-By-NC 4.0), which permits use, distribution, and reproduction in any medium, provided the original work is properly cited and is not used for commercial purposes.
Contact Information
