

Volume 4, Issue 1 (Autumn 2018)
Health in Emergencies and Disasters Quarterly 2018, 4(1): 43-48 |
Back to browse issues page


Download citation:
BibTeX | RIS | EndNote | Medlars | ProCite | Reference Manager | RefWorks
Send citation to:


BibTeX | RIS | EndNote | Medlars | ProCite | Reference Manager | RefWorks
Send citation to:
Shabanikiya H, Adel A, Esmaily H, Javan-Biparva A. Study of Car Accident Injuries Admitted to Hospitals Before and After Adoption of New Traffic Law in Iran. Health in Emergencies and Disasters Quarterly 2018; 4 (1) :43-48
URL: http://hdq.uswr.ac.ir/article-1-207-en.html
URL: http://hdq.uswr.ac.ir/article-1-207-en.html


1- Department of Health Management and Economics, School of Health, Mashhad University of Medical Sciences, Mashhad, Iran., mums
2- Student Research Committee, School of Health, Mashhad University of Medical Sciences Mashhad, Iran., mums
3- Department of Biostatistics, School of Health, Mashhad University of Medical Sciences Mashhad, Iran., mums
4- Student Research Committee, School of Health, Mashhad University of Medical Sciences Mashhad, Iran. ,javanba941@mums.ac.ir
2- Student Research Committee, School of Health, Mashhad University of Medical Sciences Mashhad, Iran., mums
3- Department of Biostatistics, School of Health, Mashhad University of Medical Sciences Mashhad, Iran., mums
4- Student Research Committee, School of Health, Mashhad University of Medical Sciences Mashhad, Iran. ,
Full-Text [PDF 670 kb]
(1702 Downloads)
| Abstract (HTML) (6938 Views)

The findings of both studies are consistent with our study results. The results of current study are also in agreement with comprehensive and detailed reports of traffic accidents in Iran [13]. However, there is a study that assessed the effect of applying negative points for offending drivers and reported that this law could reduce the total number of causalities including deaths, injuries and damages from 2010 to 2011. In this study, 13% reduction in deaths caused by road traffic accidents was reported after applying negative points rule [14]. This inconsistency may be due to various reasons such as difference in study period and place, given that both studies are descriptive.
Like other pretest and posttest studies, our study had limitations in controlling or matching all the variables affecting the main dependent variables before and after the intervention. This means that, in addition to driving violations, there are certainly other factors such as driving culture, safety of vehicles, status of hospital and prehospital emergency services, and the increased number of vehicles, that can affect the number of injuries and deaths caused by car accidents. However, according to the study design, their effects are usually neglected or maybe their status before and after the change of law (increasing fines) are assumed to be the same. This assumption may not always be true, and this is the general limitation of all pretest/posttest studies.

5. Conclusion
Totally it could be concluded that the increase in traffic fines did not seem to significantly change road traffic casualties. A more detailed study of this issue is recommended to identify possible causes of the ineffectiveness of fines. The findings of this study can be useful for policy makers in the field of transportation safety as well as community health officials, especially those involved in the regulation and enforcement of traffic rules and regulations, and be a guidance for future decision-making for formulation and adoption of traffic laws.
Ethical Considerations
Compliance with ethical guidelines
This study conducted based on a research proposal approved by Mashhad University of Medical Sciences (registration No.: 960018) and the Ethics Committee of the university (code: IR.MUMS.REC.1396.161).
Funding
This study was extracted from a research project, and supported by grant from Mashhad University of Medical Sciences (registration No.: 960018).
Authors contributions
The authors contributions is as follows: Conceptualization: Hamidreza Shabanikiya; Methodology: Hamidreza Shabanikiya, Habibollah Esmaily; Investigation: Amin Adel, Akbar Javan-Biparva; Writing–original draft: Hamidreza Shabanikiya, Amin Adel, Akbar Javan-Biparva; Writing–review & Editing: Hamidreza Shabanikiya, Habibollah Esmaily; Funding acquisition: Hamidreza Shabanikiya; and Resources: Akbar Javan-Biparva, Hamidreza Shabanikiya: Supervision.
Conflict of interest
The authors declare that there is no conflict of interest regarding the publication of this article.
References
Full-Text: (2680 Views)
1. Introduction
With the rapid development of the economy, road transport plays an important role in the transportation system of Iran. Increasing road transport in Iran has dramatically increased the number of car accidents. Therefore, planning to reduce road accidents and taking effective measures in this regard have been doubled [1]. Road accidents are one of the leading causes of death in many countries. Annually, about 1.2 million people die due to road accidents in the world. Meanwhile, the number of road traffic injuries reaches more than 50 million people worldwide [2].
The statistics have shown that road accidents after cardiovascular diseases are the second leading cause of death in Iran [3]. One study in Iran reported that the death rate from these events has increased from 1997 to 2005. However, its amount declined only in 2005. Even with this decrease, 39 deaths per 100000 people in this year is still one of the highest rates in the world, and almost twice the death rate in European countries [3]. Obviously, the number of injured caused by road accidents is 10 to 15 times more than the number of deaths, resulting in consequences such as disabilities, psychological problems and health catastrophic expenditures [4].
As mentioned before, road traffic injuries in Iran is the second leading cause of death with respect to the number of victims, and more than a third of hospital beds in Iran are taken by victims of road accidents [5], while it is the eighth leading cause of death globally. In advanced countries such as the USA, traumatic injuries, especially car accident injuries, is the seventh cause of death [6]. According to the general department of forensic medicine, the incidence of road traffic accidents leading to death was reported 28 per 100000 people in just one Province of Iran (Khorasan Razavi) in 2011.
Provision of driving rules and regulations is always one of the main strategies to prevent car accidents in all countries [7]. This strategy in Iran where the most common cause of accidents is the human error, is more important. Obviously, the rules and regulations alone could not reduce the risk of high-risk behaviors and car accidents, unless they were followed and obeyed by the drivers. In light of this, culturalizing these rules and penalizing driving offenders are two main levers of enforcing driving rules in a community [8].
In Iran, since 1974 and with the approval of traffic rules and regulations, some penalties for drivers were put into effect. After many years, these rules call for substantial revision. In 2010, a new set of new rules and penalties for driving offenses was adopted and then, after almost 40 years, these rules with higher fines were enforced throughout the country in 2016 [9, 10].
In this law, the amount of fines for 40 types of driving violations increased from 20% to 100% compared to the previous law. Eight of these violations whose fines increased by 100%, are among the highest risk driving offenses in Iran [11]. The main goal of adopting new traffic law and increased fines, was to reduce traffic violations and accidents, and consequently the resulting casualties (deaths and injuries). In this regard, in this paper we aimed to investigate and compare the number of car accident injuries admitted to the emergency wards of hospitals affiliated to Mashhad University of Medical Sciences (MUMS) before and after enforcement of new traffic laws in Iran.
2. Materials and Methods
This is a descriptive analytical study with pretest and posttest design. Study population consists of all patients injured by car accidents admitted to emergency departments of hospitals affiliated to MUMS from 2014 to 2017. In this year, MUMS had covered 13 hospitals in Mashhad City and 13 others in different surrounding counties. No sampling was conducted and all the injured car accidents were included in the study (total enumerative method).
To collect data a checklist was designed. The first part of this checklist contained 104 cells for entering data related to the number of patients injured in car accidents categorized by the hospital name and date of the accident (year, month) as well as their demographic characteristics (age, gender, and employment status). The second part contained 26 cells to enter data related to the number of patients injured in car accidents categorized by the hospital name, admission date (year, month) as well as type of injury including upper extremity injuries (in head and neck), middle extremity injuries (in arms and trunk), lower extremity injuries (in legs) and multiple injuries. The third and final part contained 26 cells to enter data related to the number of patients injured in car accidents categorized by the hospital name and admission date (year, month) as well as the location of accidents (rural roads and pedestrians, urban roads and pedestrians, and others).
After obtaining the necessary permissions from the Treatment Deputy of MUMS, the checklist was completed by extracting data from the Hospital Information System (HIS) and MedCare system. To analyze the collected data, descriptive statistics including frequency, percentage, mean, and standard deviation as well as inferential statistics including paired t test were performed in SPSS V. 16. All analyzed data were kept confidential.
3. Results
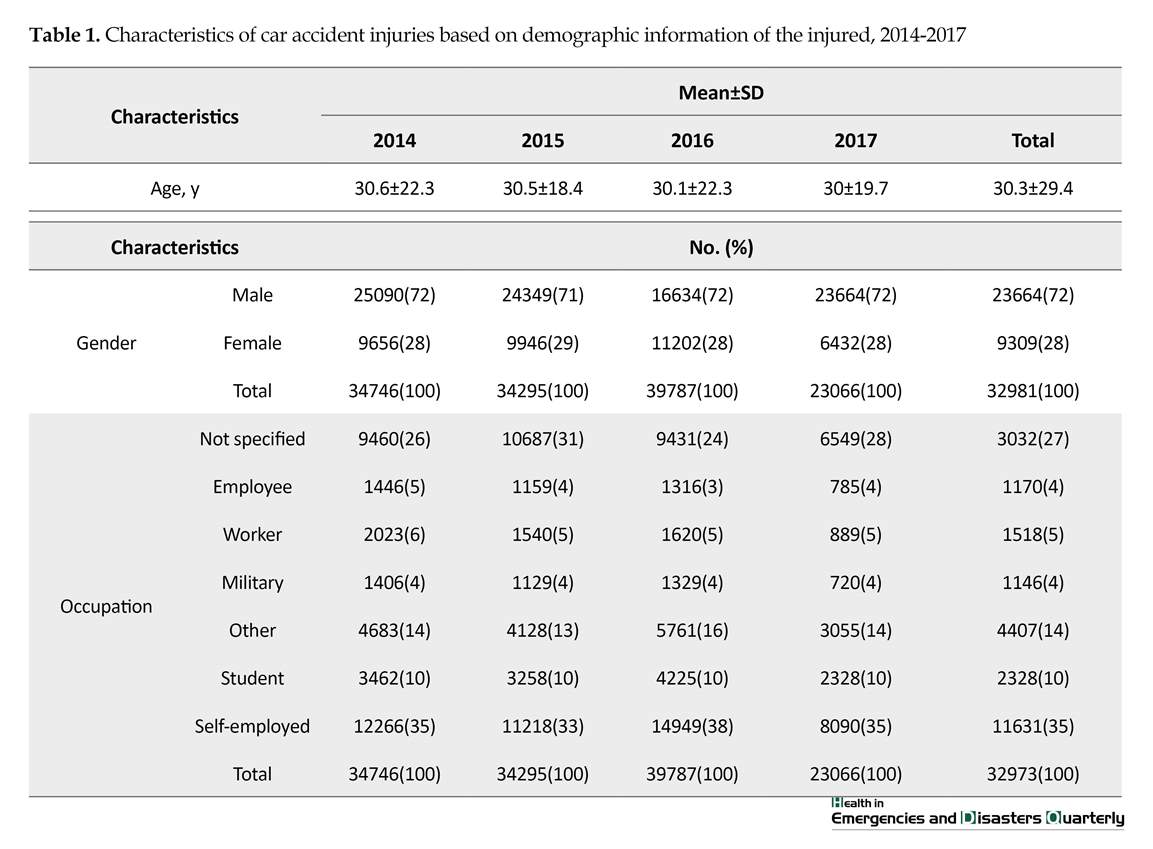
Demographic characteristics of individuals injured in car accidents from 2014 to 2017 are presented in Table 1. Their Mean±SD age was 30.3±29.4 years, and most of them were male (72%). In terms of employment status, the majority of them were self-employed (36%, n=11539) and the least of them had military occupations.
The results showed that the Mean±SD monthly number of injured patients before enforcement of new traffic law was 3053±678, which increased to 3492±690 after enforcement. Results of the t test showed a significant difference between the injured people before and after new law enforcement (P<0.05).
Figure 1 shows the change in the number of traffic injuries from 2014 to 2017 (monthly and annual average). As can be seen, there is almost similar trend in the number of monthly injuries where the summer (June and July) and the winter seasons (December and January) were the maximum (peak) and minimum point of this trend, respectively. However, in terms of the annual trend from 2014 to 2017, there was an increasing trend.
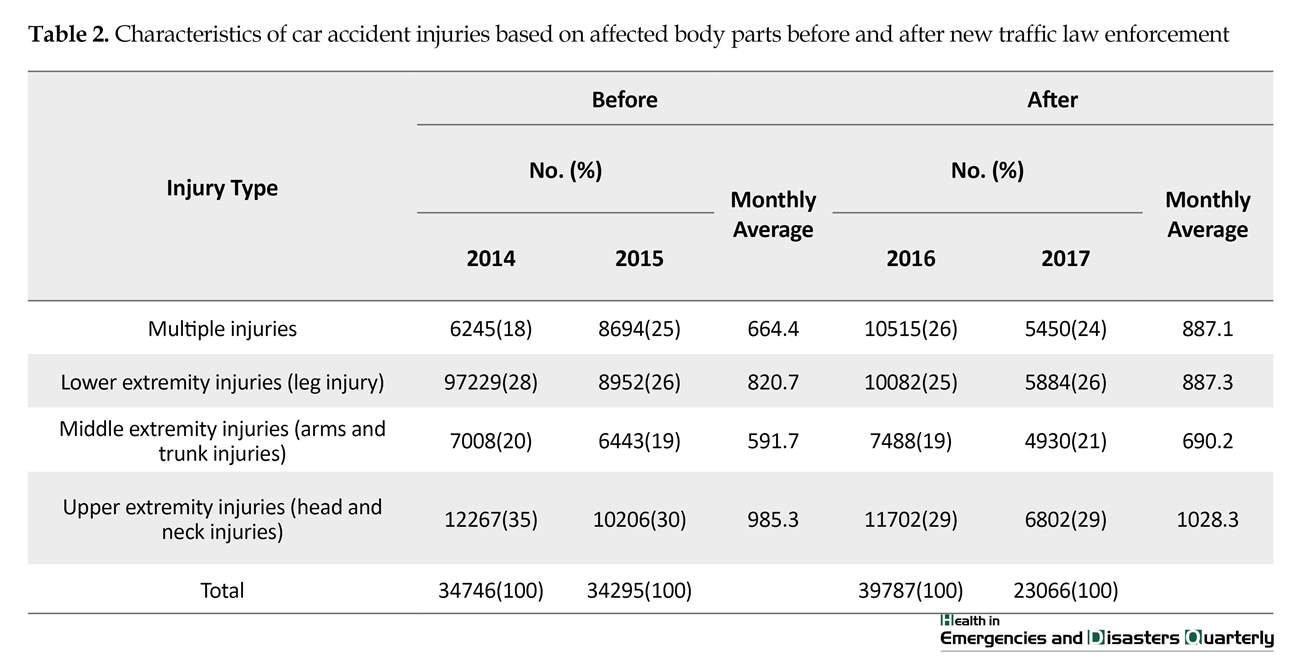
The average monthly number of injuries in all body parts has increased since the enforcement of new traffic law compared to the time before its adoption, and according to t test results, this difference was significant only in terms of multiple injuries (P<0.05). In other body parts, no significant difference was found before and after new law enforcement (Table 2).
Based on the results in Table 3, an increase in the average monthly number of car accident injuries based on accident locations was observed in all groups (rural roads and pedestrians, urban roads and pedestrians, and others). The mean difference between the number of car accident injuries was statistically significant before and after new law enforcement only for those occurred in urban roads (P<0.05).
4. Discussion
The study results indicated that the monthly average number of car accident injuries after the enforcing the new traffic law did not decrease, but rather increased. The average monthly number of injured patients based on affected body parts also increased after new law enforcement. Moreover, an increase was observed in the average monthly number of injuries based on accident locations after new law enforcement. A study on examining the effect of increasing penalties for offending motorcyclists on the injuries caused by road traffic accidents in Tehran, reported that the average daily number of patients with traffic injuries admitted to Ibn Sina Hospital in the first month of the implementation of the law increased compared to the month before its implementation [12].
Another study which investigated the effect of new traffic law enforcement on the causalities of road accidents in suburban roads of North Khorasan Province, showed that the road accidents in 2011-2012 (after enforcement) compared to 2010-2011 (before enforcement), had increased 26.5% [6]. This indicates that new traffic laws have no positive effect on preventing road traffic causalities.
With the rapid development of the economy, road transport plays an important role in the transportation system of Iran. Increasing road transport in Iran has dramatically increased the number of car accidents. Therefore, planning to reduce road accidents and taking effective measures in this regard have been doubled [1]. Road accidents are one of the leading causes of death in many countries. Annually, about 1.2 million people die due to road accidents in the world. Meanwhile, the number of road traffic injuries reaches more than 50 million people worldwide [2].
The statistics have shown that road accidents after cardiovascular diseases are the second leading cause of death in Iran [3]. One study in Iran reported that the death rate from these events has increased from 1997 to 2005. However, its amount declined only in 2005. Even with this decrease, 39 deaths per 100000 people in this year is still one of the highest rates in the world, and almost twice the death rate in European countries [3]. Obviously, the number of injured caused by road accidents is 10 to 15 times more than the number of deaths, resulting in consequences such as disabilities, psychological problems and health catastrophic expenditures [4].
As mentioned before, road traffic injuries in Iran is the second leading cause of death with respect to the number of victims, and more than a third of hospital beds in Iran are taken by victims of road accidents [5], while it is the eighth leading cause of death globally. In advanced countries such as the USA, traumatic injuries, especially car accident injuries, is the seventh cause of death [6]. According to the general department of forensic medicine, the incidence of road traffic accidents leading to death was reported 28 per 100000 people in just one Province of Iran (Khorasan Razavi) in 2011.
Provision of driving rules and regulations is always one of the main strategies to prevent car accidents in all countries [7]. This strategy in Iran where the most common cause of accidents is the human error, is more important. Obviously, the rules and regulations alone could not reduce the risk of high-risk behaviors and car accidents, unless they were followed and obeyed by the drivers. In light of this, culturalizing these rules and penalizing driving offenders are two main levers of enforcing driving rules in a community [8].
In Iran, since 1974 and with the approval of traffic rules and regulations, some penalties for drivers were put into effect. After many years, these rules call for substantial revision. In 2010, a new set of new rules and penalties for driving offenses was adopted and then, after almost 40 years, these rules with higher fines were enforced throughout the country in 2016 [9, 10].
In this law, the amount of fines for 40 types of driving violations increased from 20% to 100% compared to the previous law. Eight of these violations whose fines increased by 100%, are among the highest risk driving offenses in Iran [11]. The main goal of adopting new traffic law and increased fines, was to reduce traffic violations and accidents, and consequently the resulting casualties (deaths and injuries). In this regard, in this paper we aimed to investigate and compare the number of car accident injuries admitted to the emergency wards of hospitals affiliated to Mashhad University of Medical Sciences (MUMS) before and after enforcement of new traffic laws in Iran.
2. Materials and Methods
This is a descriptive analytical study with pretest and posttest design. Study population consists of all patients injured by car accidents admitted to emergency departments of hospitals affiliated to MUMS from 2014 to 2017. In this year, MUMS had covered 13 hospitals in Mashhad City and 13 others in different surrounding counties. No sampling was conducted and all the injured car accidents were included in the study (total enumerative method).
To collect data a checklist was designed. The first part of this checklist contained 104 cells for entering data related to the number of patients injured in car accidents categorized by the hospital name and date of the accident (year, month) as well as their demographic characteristics (age, gender, and employment status). The second part contained 26 cells to enter data related to the number of patients injured in car accidents categorized by the hospital name, admission date (year, month) as well as type of injury including upper extremity injuries (in head and neck), middle extremity injuries (in arms and trunk), lower extremity injuries (in legs) and multiple injuries. The third and final part contained 26 cells to enter data related to the number of patients injured in car accidents categorized by the hospital name and admission date (year, month) as well as the location of accidents (rural roads and pedestrians, urban roads and pedestrians, and others).
After obtaining the necessary permissions from the Treatment Deputy of MUMS, the checklist was completed by extracting data from the Hospital Information System (HIS) and MedCare system. To analyze the collected data, descriptive statistics including frequency, percentage, mean, and standard deviation as well as inferential statistics including paired t test were performed in SPSS V. 16. All analyzed data were kept confidential.
3. Results
Demographic characteristics of individuals injured in car accidents from 2014 to 2017 are presented in Table 1. Their Mean±SD age was 30.3±29.4 years, and most of them were male (72%). In terms of employment status, the majority of them were self-employed (36%, n=11539) and the least of them had military occupations.
The results showed that the Mean±SD monthly number of injured patients before enforcement of new traffic law was 3053±678, which increased to 3492±690 after enforcement. Results of the t test showed a significant difference between the injured people before and after new law enforcement (P<0.05).
Figure 1 shows the change in the number of traffic injuries from 2014 to 2017 (monthly and annual average). As can be seen, there is almost similar trend in the number of monthly injuries where the summer (June and July) and the winter seasons (December and January) were the maximum (peak) and minimum point of this trend, respectively. However, in terms of the annual trend from 2014 to 2017, there was an increasing trend.
The average monthly number of injuries in all body parts has increased since the enforcement of new traffic law compared to the time before its adoption, and according to t test results, this difference was significant only in terms of multiple injuries (P<0.05). In other body parts, no significant difference was found before and after new law enforcement (Table 2).
Based on the results in Table 3, an increase in the average monthly number of car accident injuries based on accident locations was observed in all groups (rural roads and pedestrians, urban roads and pedestrians, and others). The mean difference between the number of car accident injuries was statistically significant before and after new law enforcement only for those occurred in urban roads (P<0.05).
4. Discussion
The study results indicated that the monthly average number of car accident injuries after the enforcing the new traffic law did not decrease, but rather increased. The average monthly number of injured patients based on affected body parts also increased after new law enforcement. Moreover, an increase was observed in the average monthly number of injuries based on accident locations after new law enforcement. A study on examining the effect of increasing penalties for offending motorcyclists on the injuries caused by road traffic accidents in Tehran, reported that the average daily number of patients with traffic injuries admitted to Ibn Sina Hospital in the first month of the implementation of the law increased compared to the month before its implementation [12].
Another study which investigated the effect of new traffic law enforcement on the causalities of road accidents in suburban roads of North Khorasan Province, showed that the road accidents in 2011-2012 (after enforcement) compared to 2010-2011 (before enforcement), had increased 26.5% [6]. This indicates that new traffic laws have no positive effect on preventing road traffic causalities.
The findings of both studies are consistent with our study results. The results of current study are also in agreement with comprehensive and detailed reports of traffic accidents in Iran [13]. However, there is a study that assessed the effect of applying negative points for offending drivers and reported that this law could reduce the total number of causalities including deaths, injuries and damages from 2010 to 2011. In this study, 13% reduction in deaths caused by road traffic accidents was reported after applying negative points rule [14]. This inconsistency may be due to various reasons such as difference in study period and place, given that both studies are descriptive.
Like other pretest and posttest studies, our study had limitations in controlling or matching all the variables affecting the main dependent variables before and after the intervention. This means that, in addition to driving violations, there are certainly other factors such as driving culture, safety of vehicles, status of hospital and prehospital emergency services, and the increased number of vehicles, that can affect the number of injuries and deaths caused by car accidents. However, according to the study design, their effects are usually neglected or maybe their status before and after the change of law (increasing fines) are assumed to be the same. This assumption may not always be true, and this is the general limitation of all pretest/posttest studies.
5. Conclusion
Totally it could be concluded that the increase in traffic fines did not seem to significantly change road traffic casualties. A more detailed study of this issue is recommended to identify possible causes of the ineffectiveness of fines. The findings of this study can be useful for policy makers in the field of transportation safety as well as community health officials, especially those involved in the regulation and enforcement of traffic rules and regulations, and be a guidance for future decision-making for formulation and adoption of traffic laws.
Ethical Considerations
Compliance with ethical guidelines
This study conducted based on a research proposal approved by Mashhad University of Medical Sciences (registration No.: 960018) and the Ethics Committee of the university (code: IR.MUMS.REC.1396.161).
Funding
This study was extracted from a research project, and supported by grant from Mashhad University of Medical Sciences (registration No.: 960018).
Authors contributions
The authors contributions is as follows: Conceptualization: Hamidreza Shabanikiya; Methodology: Hamidreza Shabanikiya, Habibollah Esmaily; Investigation: Amin Adel, Akbar Javan-Biparva; Writing–original draft: Hamidreza Shabanikiya, Amin Adel, Akbar Javan-Biparva; Writing–review & Editing: Hamidreza Shabanikiya, Habibollah Esmaily; Funding acquisition: Hamidreza Shabanikiya; and Resources: Akbar Javan-Biparva, Hamidreza Shabanikiya: Supervision.
Conflict of interest
The authors declare that there is no conflict of interest regarding the publication of this article.
References
- Baluchian H. [Modeling & estimating the number of road traffic accidents (Persian)]. Rahvar. 2014; 11(26):115-35.
- Peden MM, Mathers C, Jarawanc E, Hyder A, Mohan D, Sleet D, et al. World report on road traffic injury prevention. Geneva: World Health Organization; 2004.
- Morowatisharifabad M. [The health belief model variables as predictors of risky driving behaviors among commuters in Yazd, Iran (Persian)]. Traffic Injury Prevention. 2009; 10(5):436-40. [DOI:10.1080/15389580903081016] [PMID]
- Shahla A, Charesaz S. [Injuries resulting from motorcycle-induced trauma during two years period in Shahid Motahari Clinical Center of Urmia (Persian)]. Journal of Forensic Medicine. 2006; 12(2):73-79.
- Moini M, Rezaishiraz H, Zafarghandi MR. [Characteristics and outcome of injured patients treated in urban trauma centers in Iran (Persian)]. Journal of Trauma and Acute Care Surgery. 2000; 48(3):503-7. [DOI:10.1097/00005373-200003000-00023]
- Mafi E, Ghanbari M, Hosseinzade A. [The effect of implementation of the new law traffic on human hazards of accident in roads of north Khorasan province (Persian)]. Security and Social Order Sterategic Studies. 2016; 4(3):51-68.
- Thuso M. The impact of traffic law enforcement on road accident fatalities in Botswana. Journal of Transport and Supply Chain Management. 2011; 1(1):264-77.
- Banakar R. Driving culture in Iran: Law and society on the roads of the Islamic Republic. London: I.B.Tauris & Co Ltd; 2015.
- Applied Research Office of The NAJA. [The table of fines for traffic offenses; Law for driving offenses (Persian)]. Applied Research Office of The NAJA; 2011.
- Jam-e Jam. The new benchmark for road traffic offenses in Jam-e Jam [Internet]. 2011 [Updated 2011 April 17]. Available from: http://www1.jamejamonline.ir/printable.aspx?newsnum=100841101769
- Iranian Students' News Agency. Increasing driving rates from today [Internet]. 2016 [Updated 2016 March 15]. Available from: https://www.isna.ir/news/94122515441/ %D8%A7%D9%81%D8%B2%D8%A7%DB%8C%D8%B4-%D9%86%D8%B1%D8%AE-%D8%AC%D8%B1%D8%A7%DB%8C%D9%85-%D8%B1%D8%A7%D9%86%D9%86%D8%AF%DA%AF%DB%8C-%D8%A7%D8%B2-%D8%A7%D9%85%D8%B1%D9%88%D8%B2
- Younesian M, Moradi A, Khaji A, Mesdaghinia A, Mousa Z. [Evaluation of effect Scheme for motorists’ punishment On the number of injured Caused by traffic accidents (Persian)]. Payesh. 2006; 1:19-26.
- Kayhan. An increase in fines will not affect the reduction of driving violations [Internet]. 2016. Available from: http://kayhan.ir/fa/news/65748
- Hajimaghsoud M, KHoshneshan M, Moeini M, Kameli B. [The role of negative scores in reducing driving violations and accidents (Persian)]. Traffic Management Studies. 2011; 22:37-54.
guideline: Research |
Subject:
Special
Received: 2018/04/5 | Accepted: 2018/07/28 | Published: 2018/10/1
Received: 2018/04/5 | Accepted: 2018/07/28 | Published: 2018/10/1
References
1. Baluchian H. [Modeling & estimating the number of road traffic accidents (Persian)]. Rahvar. 2014; 11(26):115-35.
2. Peden MM, Mathers C, Jarawanc E, Hyder A, Mohan D, Sleet D, et al. World report on road traffic injury prevention. Geneva: World Health Organization; 2004.
3. Morowatisharifabad M. [The health belief model variables as predictors of risky driving behaviors among commuters in Yazd, Iran (Persian)]. Traffic Injury Prevention. 2009; 10(5):436-40. [DOI:10.1080/15389580903081016] [PMID] [DOI:10.1080/15389580903081016]
4. Shahla A, Charesaz S. [Injuries resulting from motorcycle-induced trauma during two years period in Shahid Motahari Clinical Center of Urmia (Persian)]. Journal of Forensic Medicine. 2006; 12(2):73-79.
5. Moini M, Rezaishiraz H, Zafarghandi MR. [Characteristics and outcome of injured patients treated in urban trauma centers in Iran (Persian)]. Journal of Trauma and Acute Care Surgery. 2000; 48(3):503-7. [DOI:10.1097/00005373-200003000-00023] [DOI:10.1097/00005373-200003000-00023]
6. Mafi E, Ghanbari M, Hosseinzade A. [The effect of implementation of the new law traffic on human hazards of accident in roads of north Khorasan province (Persian)]. Security and Social Order Sterategic Studies. 2016; 4(3):51-68.
7. Thuso M. The impact of traffic law enforcement on road accident fatalities in Botswana. Journal of Transport and Supply Chain Management. 2011; 1(1):264-77.
8. Banakar R. Driving culture in Iran: Law and society on the roads of the Islamic Republic. London: I.B.Tauris & Co Ltd; 2015.
9. Applied Research Office of The NAJA. [The table of fines for traffic offenses; Law for driving offenses (Persian)]. Applied Research Office of The NAJA; 2011.
10. Jam-e Jam. The new benchmark for road traffic offenses in Jam-e Jam [Internet]. 2011 [Updated 2011 April 17]. Available from: http://www1.jamejamonline.ir/printable.aspx?newsnum=100841101769
11. Iranian Students' News Agency. Increasing driving rates from today [Internet]. 2016 [Updated 2016 March 15]. Available from: https://www.isna.ir/news/94122515441/ %D8%A7%D9%81%D8%B2%D8%A7%DB%8C%D8%B4-%D9%86%D8%B1%D8%AE-%D8%AC%D8%B1%D8%A7%DB%8C%D9%85-%D8%B1%D8%A7%D9%86%D9%86%D8%AF%DA%AF%DB%8C-%D8%A7%D8%B2-%D8%A7%D9%85%D8%B1%D9%88%D8%B2
12. Younesian M, Moradi A, Khaji A, Mesdaghinia A, Mousa Z. [Evaluation of effect Scheme for motorists' punishment On the number of injured Caused by traffic accidents (Persian)]. Payesh. 2006; 1:19-26.
13. Kayhan. An increase in fines will not affect the reduction of driving violations [Internet]. 2016. Available from: http://kayhan.ir/fa/news/65748
14. Hajimaghsoud M, KHoshneshan M, Moeini M, Kameli B. [The role of negative scores in reducing driving violations and accidents (Persian)]. Traffic Management Studies. 2011; 22:37-54.
Send email to the article author
| Rights and permissions | |
 |
This work is licensed under a Creative Commons Attribution-NonCommercial 4.0 International License. |
Copyright © The Author(s);
This is an open access article distributed under the terms of the Creative Commons Attribution License (CC-By-NC), which permits use, distribution, and reproduction in any medium, provided the original work is properly cited and is not used for commercial purposes.
Contact Information
This is an open access article distributed under the terms of the Creative Commons Attribution License (CC-By-NC), which permits use, distribution, and reproduction in any medium, provided the original work is properly cited and is not used for commercial purposes.
Contact Information
