

Volume 4, Issue 3 (Spring 2019)
Health in Emergencies and Disasters Quarterly 2019, 4(3): 165-172 |
Back to browse issues page


Download citation:
BibTeX | RIS | EndNote | Medlars | ProCite | Reference Manager | RefWorks
Send citation to:


BibTeX | RIS | EndNote | Medlars | ProCite | Reference Manager | RefWorks
Send citation to:
Omidi M R, Jafari Eskandari M, Raissi S, Shojaei A A. Providing an Appropriate Prediction Model for Traffic Accidents: A Case Study on Accidents in Golestan, Mazandaran, Guilan, and Ardebil Provinces. Health in Emergencies and Disasters Quarterly 2019; 4 (3) :165-172
URL: http://hdq.uswr.ac.ir/article-1-220-en.html
URL: http://hdq.uswr.ac.ir/article-1-220-en.html


1- Department of Industrial Engineering, South Tehran Branch, Islamic Azad University، Tehran, Iran.
2- Department of Industrial Engineering, Payame Noor University, Tehran, Iran. ,MROMIDI_91@YAHOO.COM
2- Department of Industrial Engineering, Payame Noor University, Tehran, Iran. ,
Full-Text [PDF 797 kb]
(1699 Downloads)
| Abstract (HTML) (4521 Views)
2. Materials and methods
This research was a longitudinal study with time series. We used the traffic injuries data in the provinces of Golestan, Mazandaran, Guilan, and Ardebil between April 2009 and March 2016 obtained from the forensic organization. For predicting the future number of traffic injuries, the Box-Jenkins methodology was applied. Time series is a type of data that occurs in the form of a specific variable over time. The main application of analyzing time series is prediction. There are several methods for predicting the time series; the Box-Jenkins is among the best available predicting methods [14].
In Box-Jenkins analysis, the prediction of a single-variable time series is conducted by statistical modeling. The Box-Jenkins prediction method is performed in 4 stages, including identification, estimation, diagnostic checking, and forcasting [15]. The Box-Jenkins models include the Autoregressive (AR) , the moving average (MA), the Autoregressive Moving Average (ARMA), and the Autoregressive Integrated Moving Average (ARIMA) processes.
AR process: This pattern is, in fact, a multiple regression model, but the dependent variable Z is not regressed on independent variables (X1, X2,...XN) but its own previous values; this is why such process is called autoregressive. An autoregressive process with the order of P is shown by the notation AR(p). If at is a single pure random process with zero mean and constant variance, then, the Z autoregressive process of P order is expressed as Equation 1.

MA process: The moving average model is used to express a phenomenon in which the events create an instantaneous effect that only stays for a short time. If at is a pure random process with constant variance and zero mean, then the process Zt is called the MA model of q order when the following equation (Equation 2) holds; in which, θi is constant, and θ0 is considered to be one. The MA model of order q is represented by the notation MA(q) .
ARMA process: In this model, the probability that the Z series has the characteristics of both the AR and MA processes is high, which is why it is called ARMA. Therefore, Z is called an ARMA (p, q) process, which includes the P order of auto-regression and q order of moving average (Equation 3).

ARIMA process: The models above are based on the assumption that the time series are static. As the mean and variance of time series are constant and their covariance is unchanged over time. However, many time series are non-constant and are stacked.
If a time series occurs after the d-order deduction, and be modeled by the ARMA (p, q) process, then the main time series of the ARIMA (p, d, q) is where p is the number of autoregressive sentences, q is the number of moving averages, and d is the number of times for the time series to reside [16]. The basic question in this research is that which template should be selected between the different patterns of time series and on what basis the choices are selected.
Therefore, the most important issue in this method is to determine the number of data gaps in casualties and to determine the random variable structure in the model. As a result, we used the standard methodology in this area; i.e., the Box-Jenkins method. In this method, the number of interruptions and the structure of the random variables are determined based on Autocorrelation Function (ACF) and Partial Autocorrelation Function (PACF) between the model errors.
3. Results
The Box-Jenkins methodology implementation results for separately predicting injuries in four provinces were as follows:
Stage 1 (Identification): At this stage, the actual values of p, q, and d of the ARIMA model are determined, using the ACF and partial correlation charts tool (PACF) for this purpose. The PACF assessed the correlation between the observations, in other words, the correlation between Zt and Zt-k after the elimination of the intermediating Z effects. The purpose of the Box-Jenkins model is to identify and determine the statistical model, which can be interpreted as a model of actual sample data from a random process.
To use this model for prediction, the features of this model must be constant over time. If the observed series is not constant to the average, then the series can be deducted to be converted to a static series. The time series data of Golestan Province were staticized after two times deduction and the data of Mazandaran, Guilan and Ardebil provinces became constant after one time deduction.
After staticizing the data by the shape of the ACF and PACF functions, the fit model for the data is identified. Analysis and evaluation of ACF and PACF suggest that ARIMA (4.2.4) is the most suitable model for traffic casualties in Golestan Province. This means that the time series should be deducted twice to be static (d=2); then be modeled by an ARMA (4.4) process. Also, the fittest models for the number of casualties in the provinces of Mazandaran, Guilan, and Ardabil were ARIMA (3, 1, 5), ARIMA (3, 1, 4), and ARIMA (5, 1, 2), respectively.
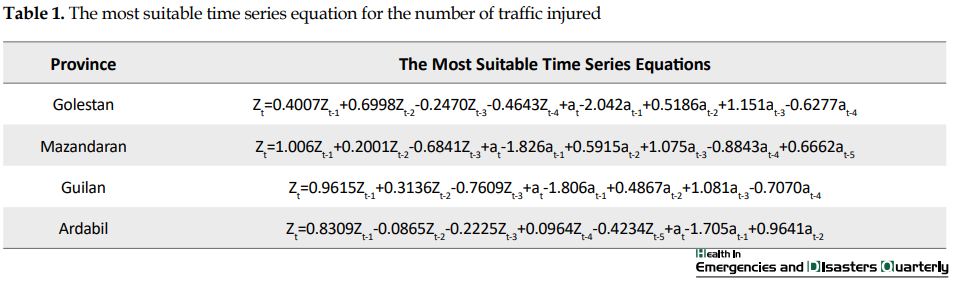
The second stage (Estimate): To estimate the coefficients of the model, the least squares method was used, but when nonlinear parameters are applied to the model, we have to use nonlinear methods. The model coefficients for the four provinces were obtained in the form of the following equations:
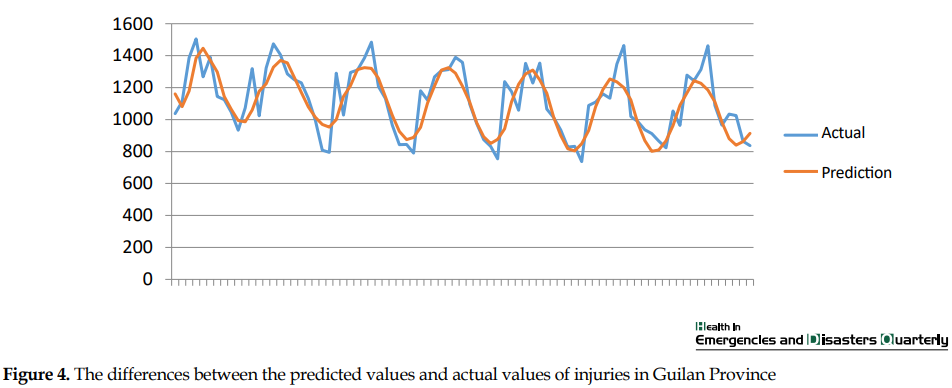
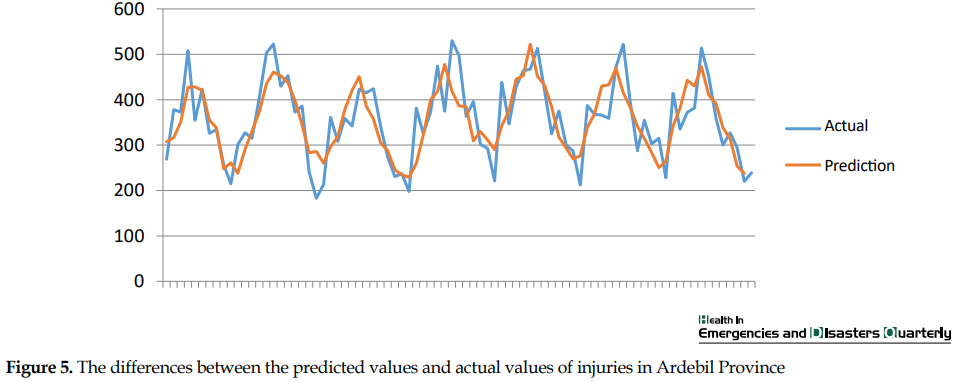
The third stage (Diagnostic checking): After choosing a specific model of ARIMA and estimating its parameters, we must check whether the selected model fits the data well. In other words, we should determine if the model is the most suitable type for describing the data The difference between the predicted and actual values is shown in Figures 2, 3, 4, 5. This is because an ARIMA model may provide better fitting for data. A simple test to check this point is that the remainders resulting from this model have a white noise; i.e. have a normal distribution, constant variance, and zero mean. The obtained results indicated that the remaining for the number of injuries in each of the four provinces are white noise.


Full-Text: (1182 Views)
1. Introduction
Today, despite the scientific and industrial development and the use of various facilities, there is a challenge called “accidents” that are increasing day by day [1]. The World Health Organization considers accidents as an event or a chain of events that can cause injury, illness or damage to equipment, people, and the environment [2]. Driving accidents are among the most important health issues that threaten human health [3]. So that every 50 seconds one death and every 2 seconds, one injury occurs in the world [4].
Accidents not only damage people but also increase traffic, slow down transportation, and blocks the roads [5]. Traffic injuries as predictable and preventable events are among the most important public health challenges that impose many socioeconomic burdens on society [6]. Therefore, it is necessary to investigate this area and take measures to reduce such accidents, as well as to employ tools and methods for analyzing data as a valuable source of information in this area [7]. Data mining science can be very beneficial and be used as a decision-making tool for planning to reduce traffic accidents and their irreparable losses. Reducing the number of road accident victims and injuries is imperative in every moral-based system [8].
Human casualties and injuries are the worst consequence of accidents, especially traffic accidents [9]. Bougueroua and Carins reported that predictive models had a large application in traffic accident analysis and were widely used to identify road safety factors, identify and prioritize road accident locations, assess safety performance in accidents, estimate the number of injuries and trauma of accidents and the determination of the risk index to identify the safest route in the dynamic system of roads [10]. The costs imposed by injuries to society are very high, which is due to the involvement of all age groups. The total lost years of life due to the damages caused by accidents in the world is more than other causes of death [11].
More than 90% of road accident deaths occur in low- and middle-income countries that only have 45% of the world’s automobiles [12]. Developed countries have taken measures to reduce accident-emerged casualties; however, in developing countries, this is still one of the major causes of unnatural deaths. Every year, different countries spend a lot of money on reducing accidents and mortalities due to accidents. In our country, due to the increase in the number of vehicles and the lack of attention of drivers to road safety regulations, the number, and severity of traffic accidents have risen. Besides reducing safety, accidents impose a high cost to the community.
Financial and human losses, delays in traffic, and reducing the speed of transportation are among the impacts of accidents on society, which reduce national wealth. Omidi et al. evaluated the traffic accidents trend in the country [13]. Bahadori Fard et al. reported that the process of reducing accidents has begun in Iran [14]. Nevertheless, Iran is still one of the countries with the highest rate of traffic accidents and consequent deaths and injuries. This fact necessitates conducting future studies and providing predicting models in this field. The Box-Jenkins methodology, one of the most widely used methods by researchers in the behavior of transportation systems, was applied in the current research to predict the number of injured people in the four provinces of Golestan, Mazandaran, Guilan, and Ardebil. Moreover, we explored the pattern and time series equation of each province (Table 1).
2. Materials and methods
This research was a longitudinal study with time series. We used the traffic injuries data in the provinces of Golestan, Mazandaran, Guilan, and Ardebil between April 2009 and March 2016 obtained from the forensic organization. For predicting the future number of traffic injuries, the Box-Jenkins methodology was applied. Time series is a type of data that occurs in the form of a specific variable over time. The main application of analyzing time series is prediction. There are several methods for predicting the time series; the Box-Jenkins is among the best available predicting methods [14].
In Box-Jenkins analysis, the prediction of a single-variable time series is conducted by statistical modeling. The Box-Jenkins prediction method is performed in 4 stages, including identification, estimation, diagnostic checking, and forcasting [15]. The Box-Jenkins models include the Autoregressive (AR) , the moving average (MA), the Autoregressive Moving Average (ARMA), and the Autoregressive Integrated Moving Average (ARIMA) processes.
AR process: This pattern is, in fact, a multiple regression model, but the dependent variable Z is not regressed on independent variables (X1, X2,...XN) but its own previous values; this is why such process is called autoregressive. An autoregressive process with the order of P is shown by the notation AR(p). If at is a single pure random process with zero mean and constant variance, then, the Z autoregressive process of P order is expressed as Equation 1.
MA process: The moving average model is used to express a phenomenon in which the events create an instantaneous effect that only stays for a short time. If at is a pure random process with constant variance and zero mean, then the process Zt is called the MA model of q order when the following equation (Equation 2) holds; in which, θi is constant, and θ0 is considered to be one. The MA model of order q is represented by the notation MA(q) .
ARMA process: In this model, the probability that the Z series has the characteristics of both the AR and MA processes is high, which is why it is called ARMA. Therefore, Z is called an ARMA (p, q) process, which includes the P order of auto-regression and q order of moving average (Equation 3).
ARIMA process: The models above are based on the assumption that the time series are static. As the mean and variance of time series are constant and their covariance is unchanged over time. However, many time series are non-constant and are stacked.
If a time series occurs after the d-order deduction, and be modeled by the ARMA (p, q) process, then the main time series of the ARIMA (p, d, q) is where p is the number of autoregressive sentences, q is the number of moving averages, and d is the number of times for the time series to reside [16]. The basic question in this research is that which template should be selected between the different patterns of time series and on what basis the choices are selected.
Therefore, the most important issue in this method is to determine the number of data gaps in casualties and to determine the random variable structure in the model. As a result, we used the standard methodology in this area; i.e., the Box-Jenkins method. In this method, the number of interruptions and the structure of the random variables are determined based on Autocorrelation Function (ACF) and Partial Autocorrelation Function (PACF) between the model errors.
3. Results
The time series of the number of traffic-accident injured people in the provinces of Golestan, Mazandaran, Guilan, and Ardebil, who were reported to forensic medicine from April 2009 to March 2015, are displayed in Figure 1. It shows that the number of casualties in Mazandaran Province is higher than that in other studied provinces.

The Box-Jenkins methodology implementation results for separately predicting injuries in four provinces were as follows:
Stage 1 (Identification): At this stage, the actual values of p, q, and d of the ARIMA model are determined, using the ACF and partial correlation charts tool (PACF) for this purpose. The PACF assessed the correlation between the observations, in other words, the correlation between Zt and Zt-k after the elimination of the intermediating Z effects. The purpose of the Box-Jenkins model is to identify and determine the statistical model, which can be interpreted as a model of actual sample data from a random process.
To use this model for prediction, the features of this model must be constant over time. If the observed series is not constant to the average, then the series can be deducted to be converted to a static series. The time series data of Golestan Province were staticized after two times deduction and the data of Mazandaran, Guilan and Ardebil provinces became constant after one time deduction.
After staticizing the data by the shape of the ACF and PACF functions, the fit model for the data is identified. Analysis and evaluation of ACF and PACF suggest that ARIMA (4.2.4) is the most suitable model for traffic casualties in Golestan Province. This means that the time series should be deducted twice to be static (d=2); then be modeled by an ARMA (4.4) process. Also, the fittest models for the number of casualties in the provinces of Mazandaran, Guilan, and Ardabil were ARIMA (3, 1, 5), ARIMA (3, 1, 4), and ARIMA (5, 1, 2), respectively.
The second stage (Estimate): To estimate the coefficients of the model, the least squares method was used, but when nonlinear parameters are applied to the model, we have to use nonlinear methods. The model coefficients for the four provinces were obtained in the form of the following equations:
The third stage (Diagnostic checking): After choosing a specific model of ARIMA and estimating its parameters, we must check whether the selected model fits the data well. In other words, we should determine if the model is the most suitable type for describing the data The difference between the predicted and actual values is shown in Figures 2, 3, 4, 5. This is because an ARIMA model may provide better fitting for data. A simple test to check this point is that the remainders resulting from this model have a white noise; i.e. have a normal distribution, constant variance, and zero mean. The obtained results indicated that the remaining for the number of injuries in each of the four provinces are white noise.
The difference between the predicted values and actual values in predicting injuries using the Box-Jenkins method is shown in the following graphs:
One of the important criteria for determining the proper fitting of the model is the mean absolute percentage of error (MAPE). The more it is closer to zero, the better the predictive power of the model. The values of this indicator for Golestan Province was 0.114, for Mazandaran province 0.064, for Guilan Province 0.078, and for Ardebil Province 0.1250. This finding indicates the accuracy of prediction equations in this study.
The fourth stage (Forecasting): Estimated values using time series templates are presented in Table 2.
The annual prediction values from the total predicted values for the years 2016 to 2019 are the number of injuries in the four provinces. Table 2 indicates the increasing number of casualties in Golestan Province and the decreasing trend in Guilan, Mazandaran, and Ardebil provinces.
4. Discussion
Considering that many people lose their lives or suffer injuries in traffic accidents annually, this study examined the number of casualties reoprted to the forensic medicine in Golestan, Guilan, Mazandaran, and Ardebil provinces as tourism destinations in the north and northwest of Iran. The prediction in the field of transport system engineering is a valuable factor available to experts, authorities, and researchers for analyzing data and future planning. In this study, the statistical data on the number of traffic injuries reported to forensic medicine in the provinces of Golestan, Mazandaran, Guilan, and Ardabil from April 2009 to March 2015 were compared. The results indicated that the highest injuries occurred in Mazandaran Province compared to other studied provinces.
The Box-Jenkins method is one of the methods used in transport and health systems engineering. The statistical data of the casualties were staticized for initial preparation by static deduction; the degree of deduction of injuries in Golestan Province was two, and in other studied provinces one. The achieved results suggested that appropriate time series models to predict Golestan, Mazandaran, Guilan, and Ardabil injuries were ARIMA (4, 2, 4), ARIMA (3, 1, 5), ARIMA (3, 1, 4), and ARIMA (5, 1.2), respectively. The high accuracy of the Box-Jenkins method, which was tested with a precision meter of the MAPE, indicates that researchers can use this method to predict the number of injured in the studied provinces.
Omidi et al. investigated the traffic accident rate in Zanjan Province and predicted the accidents for the coming years. The results of their research revealed that the MAPE of the Box-Jenkins method to predict traffic accidents in Zanjan Province equals to 0.13. These data suggest that the predicted values in the present study are more accurate than theirs [13].
Bahadori Monfared et al. assessed the traffic accidents in the entire country using the Box-Jenkins method; they reported high accuracy of this method to predict traffic accidents in Iran [14]. Sahebi et al. considered the precision of predicting methods like the Box-Jenkins appropriate in predicting traffic accidents in Iranian out-of-town accidents [15]. Omidi and Omidi, in their study of the traumatic traffic survey in Semnan Province, reported that the Box-Jenkins model was more accurate than the gray and harmonic models in predicting crashes [16].
Chukwutoo et al. compared the accuracy of ARIMA and ARIMAX methods for predicting car accidents in Nigeria that occurred between 2007 and 2015. Their comparison showed that the ARIMAX model was better than the ARIMA model in predicting car accidents [17]. Liue et al. reported that if the Box-Jenkins time series is combined with other methods, its prediction accuracy could be increased [18]. The predicted values indicate that the increasing number of casualties in the province of Golestan (reaching 10724 people in 2019), and a decreasing trend in Mazandaran, Guilan, and Ardebil (reaching 12123, 10528 and 3497 in 2019, respectively).
Bahadori Monfared et al. reported the reducing trend of traffic accidents in Iran [14]. Omidi et al. also reported the reduced rate of traffic accidents in Zanjan Province; however, Chukwutoo et al. reported an increasing trend of accidents in Nigeria in the future [13, 17].
5. Conclusion
The obtained results indicated that the number of accidents in Golestan Province is rising but declining in Mazandaran, Guilan, and Ardebil provinces. Considering the obtained results, it is suggested that authorities use the Box-Jenkins time series with its precise prediction ability, for future studies and taking strategic decisions in the field of transportation systems.
Moreover, the design of predictive applications based on the Box-Jenkins method gives the healthcare system users the advantage of predicting the casualties and deaths of traffic accidents at any time. According to the results of this study on the expected reduction of traffic accidents in Mazandaran, Guilan and Ardebil provinces in the future, it is recommended that the traffic police of these provinces take measures to accelerate such reduction by building culture and using the media (given the drivers are influenced by the roadside police measures and the decline in the number of casualties). Additionally, the officials in Golestan Province must take steps to reduce the underlying causes of the increase in accidents in that province. Any accident is caused by a violation of the traffic law that occurs when the driving laws are ignored.
Ethical Considerations
Compliance with ethical guidelines
The authors of this article have followed all ethical principles.
Funding
This research did not receive any specific grant from funding agencies in the public, commercial, or not-forpro it sectors.
Authors' contributions
Writing text and doing calculations: Mohammad Reza Omidi; Interviewing and distributing questionnaires: Meisam Jafari Eskandari and Sedigh Raissi; Data collection and analysis: Amir Abas Shojaei.
Conflict of interest
The authors certify that they have no affiliation with or involvement in any organization or entity with any financial interest, or non- financial interest in the subject matter or materials dismissed in this manuscript.
References
- Khanke H, Maleknia S. Verification of reported chief complaints about the injuries in Tehran road accidents from pre-hospital emergency, years 2010-2011. Health in Emergencies and Disasters Quarterly. 2014; 1(2):22-36.
- Ebrahimi H, Sadeghi M, Azami AA, Bazghaleh M. Epidemiological study of fatal and nonfatal road traffic accidents and their outcomes on children and adolescents in Shahroud, Iran. Health in Emergencies and Disasters Quarterly. 2016; 1(2):97-104.
- Másilková M. Health and social consequences of road traffic accidents. Kontakt. 2017; 19(1):e43-e7. [DOI:10.1016/j.kontakt.2017.01.007]
- Rodríguez-López J, Marrero GA, González RM, Leal-Linares T. Road accidents and business cycles in Spain. Accident Analysis & Prevention. 2016; 96:46-55. [DOI:10.1016/j.aap.2016.07.029] [PMID]
- Fountas G, Anastasopoulos PC, Mannering FL. Analysis of vehicle accident-injury severities: A comparison of segment- versus accident-based latent class ordered probit models with class-probability functions. Analytic Methods in Accident Research. 2018; 18:15-32. [DOI:10.1016/j.amar.2018.03.003]
- Mahapatra A, Sharma P. Association of Internet addiction and alexithymia: A scoping review. Addictive Behaviors. 2018; 81:175-82. [DOI:10.1016/j.addbeh.2018.02.004] [PMID]
- Cao H, Wang J, Li Y, Li D, Guo J, Hu Y, et al. Trend analysis of mortality rates and causes of death in children under 5 years old in Beijing, China from 1992 to 2015 and forecast of mortality into the future: An entire population-based epidemiological study. BMJ Open. 2017; 7(9):e015941. [DOI:10.1136/bmjopen-2017-015941] [PMID] [PMCID]
- Korchagin V, Ljapin S, Rizaeva J, Konovalova V. Subsystem of road accident consequences elimination. Methodology of Subsystem Efficiency Improvement. Transportation Research Procedia. 2017; 20:316-20. [DOI:10.1016/j.trpro.2017.01.033]
- Goel G, Sachdeva SN. Analysis of road accidents on NH-1 between RD 98 km to 148 km. Perspectives in Science. 2016; 8:392-4. [DOI:10.1016/j.pisc.2016.04.086]
- Bougueroua M, Carnis L. Economic development, mobility and traffic accidents in Algeria. Accident Analysis & Prevention. 2016; 92:168-74. [DOI:10.1016/j.aap.2016.03.016] [PMID]
- Richter T, Ruhl S, Ortlepp J, Bakaba E. Causes, consequences and countermeasures of overtaking accidents on two-lane rural roads. Transportation Research Procedia. 2017; 25:1989-2001. [DOI:10.1016/j.trpro.2017.05.395]
- Singh SK. Road traffic accidents in India: Issues and challenges. Transportation Research Procedia. 2017; 25:4708-19. [DOI:10.1016/j.trpro.2017.05.484]
- Omidi N, Asgari H, Omidi MR, Jafari Eskandari M. [The study of traffic accidents in Zanjan Province between March 2009 and February 2016 and comparing the mathematical method to predict traffic injuries referred to the Forensic Medicine between 2017 and 2020 (Persian)]. Medical Sciences Journal of Islamic Azad Univesity. 2017; 27(3):201-8.
- Bahadori Monfared A, Soori H, Mehrabi Y, Rahmati Roudsar M, Esmaili A, Salehi M, et al. [A model for prediction of on the rate of mortality due to road traffic accidents in Iran (Persian)]. Research in Medicine. 2013; 36(1 suppl):7-11.
- Sahebi S, Mirbaha B, Mahpour A, Norouz Oliaee M. [Predicting pedestrian accidents in rural roads using ordered logit model (Persian)]. Quarterly Journal of Transportation Engineering. 2015; 6(4):581-92.
- Omidi N, Omidi MR. Estimating accident-related traumatic injury rate by future studies models in Semnan Province, Iran. Health in Emergencies and Disasters Quarterly. 2018; 3(4):191-8. [DOI:10.32598/hdq.3.4.191]
- Ihueze CC, Onwurah UO. Road traffic accidents prediction modelling: An analysis of Anambra State, Nigeria. Accident Analysis & Prevention. 2018; 112:21-9. [DOI:10.1016/j.aap.2017.12.016] [PMID]
- Liu H, Tian HQ, Li YF. An EMD-recursive ARIMA method to predict wind speed for railway strong wind warning system. Journal of Wind Engineering and Industrial Aerodynamics. 2015; 141:27-38. [DOI:10.1016/j.jweia.2015.02.004]
Type of Study: Research |
Subject:
General
Received: 2018/06/28 | Accepted: 2019/01/5 | Published: 2019/07/23
Received: 2018/06/28 | Accepted: 2019/01/5 | Published: 2019/07/23
Send email to the article author
| Rights and permissions | |
 |
This work is licensed under a Creative Commons Attribution-NonCommercial 4.0 International License. |
Copyright © The Author(s);
This is an open access article distributed under the terms of the Creative Commons Attribution License (CC-By-NC), which permits use, distribution, and reproduction in any medium, provided the original work is properly cited and is not used for commercial purposes.
Contact Information
This is an open access article distributed under the terms of the Creative Commons Attribution License (CC-By-NC), which permits use, distribution, and reproduction in any medium, provided the original work is properly cited and is not used for commercial purposes.
Contact Information
