

Volume 8 - Special Issue
Health in Emergencies and Disasters Quarterly 2023, 8 - Special Issue: 259-266 |
Back to browse issues page


Download citation:
BibTeX | RIS | EndNote | Medlars | ProCite | Reference Manager | RefWorks
Send citation to:


BibTeX | RIS | EndNote | Medlars | ProCite | Reference Manager | RefWorks
Send citation to:
Ebrahimipour H, Mahmoudian P, Vafainejad R, Ebrazeh A, Hosseini S E, Shakeri K et al . Analysis of Spatial Distribution of Pre-hospital Emergency Medical Services in Traffic Accidents: Mashhad City, Iran. Health in Emergencies and Disasters Quarterly 2023; 8 :259-266
URL: http://hdq.uswr.ac.ir/article-1-367-en.html
URL: http://hdq.uswr.ac.ir/article-1-367-en.html
Hossein Ebrahimipour1 

 , Payam Mahmoudian *2 , Reza Vafainejad3 , Ali Ebrazeh4 , Seyedah Elaha Hosseini5 , Khosro Shakeri4 , Seyed Hassan Mohsenian6
, Payam Mahmoudian *2 , Reza Vafainejad3 , Ali Ebrazeh4 , Seyedah Elaha Hosseini5 , Khosro Shakeri4 , Seyed Hassan Mohsenian6
1- Research Center for Social Factors Affecting Health, Mashhad University of Medical Sciences, Mashhad, Iran.
2- Student Research Committee, Faculty of Medical Information and Management, Iran University of Medical Sciences, Tehran, Iran. ,payam_mahmoudian@yahoo.com
3- Center for Medical Accidents and Emergencies, Mashhad University of Medical Sciences, Mashhad, Iran.
4- Department of Public Health, Faculty of Health, Qom University of Medical Sciences, Qom, Iran.
5- Student Research Committee, Faculty of Medical Information and Management, Iran University of Medical Sciences, Tehran, Iran.
6- Student Research Committee, Faculty of Medical Information and Management, Isfahan University of Medical Sciences, Isfahan, Iran.
2- Student Research Committee, Faculty of Medical Information and Management, Iran University of Medical Sciences, Tehran, Iran. ,
3- Center for Medical Accidents and Emergencies, Mashhad University of Medical Sciences, Mashhad, Iran.
4- Department of Public Health, Faculty of Health, Qom University of Medical Sciences, Qom, Iran.
5- Student Research Committee, Faculty of Medical Information and Management, Iran University of Medical Sciences, Tehran, Iran.
6- Student Research Committee, Faculty of Medical Information and Management, Isfahan University of Medical Sciences, Isfahan, Iran.
Keywords: Spatial distribution, Physical access, Pre-hospital Emergency Medical Services (EMS), Geographic Information systems (GIS)
Full-Text [PDF 1454 kb]
(1334 Downloads)
| Abstract (HTML) (4382 Views)
Full-Text: (1004 Views)
1. Introduction
Providing emergency medical services is one of the crucial aspects of patient treatment. Since the provision of accurate and fast services in emergencies can lead to the survival of patients, it is highly valuable [1]. Pre-hospital Emergency Medical services (EMS) is the first treatment level provided by Emergency Medical Technicians (EMTs) and rescuers to patients suffering from life-threatening conditions before delivery to the hospital. EMS seeks to reduce response time. This time is known between an emergency call made to an ambulance station and the time when an ambulance dispatched to assist arrives at the scene and a shorter response time improves survival [2]. Response time is a vital factor in determining the quality of pre-hospital EMS. This time is also called the golden time because the percentage of survival of patients who were treated within the first hour of visiting the hospital is higher than that of patients who waited longer [3].
The time it takes to get to the patient’s bedside is also an effective barrier for service providers. Access to services is defined as the ability of people to use services at any time and place. Due to the importance of access, the decisions taken in the health service system are influenced by the quality of services available in different places, at different times, the cost of services, and the ease of access to services [4].
The issue of access to urban services is one of the vital issues that affects the economy of the city from various dimensions. In other words, the inappropriate distribution of service users, in addition to spending high transportation and fuel costs to access them, wastes citizens’ time and creates traffic jams, and results in costs that cannot be calculated most of the time. Also, sometimes the lack of proper access to some applications exposes people’s health to risk. Healthcare services are an example of this type, which requires timely and appropriate access for all members of society [5]. In this regard, the Geographic Information System (GIS) examines the geographic dimension of access. GIS measures geographic access more accurately and analyzes geographic disparities in access to services [4]. The use of this system is considered the best tool for decision-making in crisis management, according to the capabilities of GIS data integration and the possibility of complex analysis of spatial and non-spatial data. In addition, GIS can be used to locate pre-hospital emergency bases before a crisis and identify high-risk areas during accidents [6].
Health and medical indicators are the vital indicators of development showing that geographical distribution and development are unevenly taking place [7]; Therefore, with the awareness of the importance of knowing the current situation of societies and geographical environments to planning optimally for the future, and considering the importance and necessity of developing health indicators, as the most basic and basic needs of any healthy society, the present research seeks to measure the distribution of emergency centers in Mashhad City in 2014.
2. Materials and Methods
The present study is descriptive-cross-sectional and applied. The studied population for the high-accident areas of Mashhad City includes 21142 missions carried out in 2014. The research environment is the medical emergency and accident management center of Khorasan Razavi Province, Iran, and the information needed by the researcher was collected by receiving the injured files from the statistics unit of the center. In the survey of the high-accident areas of Mashhad City, the files of the injured were examined as the census. According to the information available in the files of the injured, 21142 accidents resulting in injuries were recorded in 2013. After collecting the available addresses from the files, they were entered into the GIS spatial analysis software, the desired information was analyzed, and its numerical information was produced. To analyze spatial data using the inverse distance weighting method, which is based on inverse distances, the distribution of stations has been analyzed according to their area. Time coverage of emergency centers has been performed based on network analysis in the GIS software environment.
Time coverage is the range in which, despite traffic restrictions during peak hours, the ambulance can reach the accident site in standard time. Ambulance movement is considered in this analysis based on the road network. The average speed of an ambulance during peak traffic is considered to be 15 km/h. The periods considered in this analysis are equal to 4, 6, and 8 minutes. According to the reports received from the emergency medical center of Mashhad University of Medical Sciences, the time interval from the moment of calling the center 115 to the ambulance leaving the base is 2 minutes and 23 seconds. As a result, the time taken by the ambulance to leave the base and arrive at the accident site is 1:47, 3:47, and 5:47. By forming the database of the road network of Mashhad City in the GIS environment as communication links and defining emergency centers as facility, the radius of emergency centers was drawn on the road network of Mashhad using the service area method.
3. Results
Regarding the distribution of accidents in Mashhad City, the Panjtan axis with a very significant difference from other axes has had 288 accidents per kilometer of the route, followed by 143 and 95 accidents per kilometer in Tabarsi and Azadi, respectively. According to the surveys conducted on the frequency of accidents in squares and intersections, Imam Hossein square, Fajr Bridge, and Abbaspur square had the highest number of accidents in 2014. The number of accidents in these three squares on average (118 accidents) is almost twice the average of other squares (65 accidents).
It can be said that the transportation axes of settlements on the outskirt of Mashhad City, such as Qale Sakhteman, Tabarsi, Golshahr, Khaje Rabi, Darvi, Panjtan, Khin Arab, and Resalat (Siman Road) towards the city center show a pattern of repetition of accidents along the way (Figure 1).
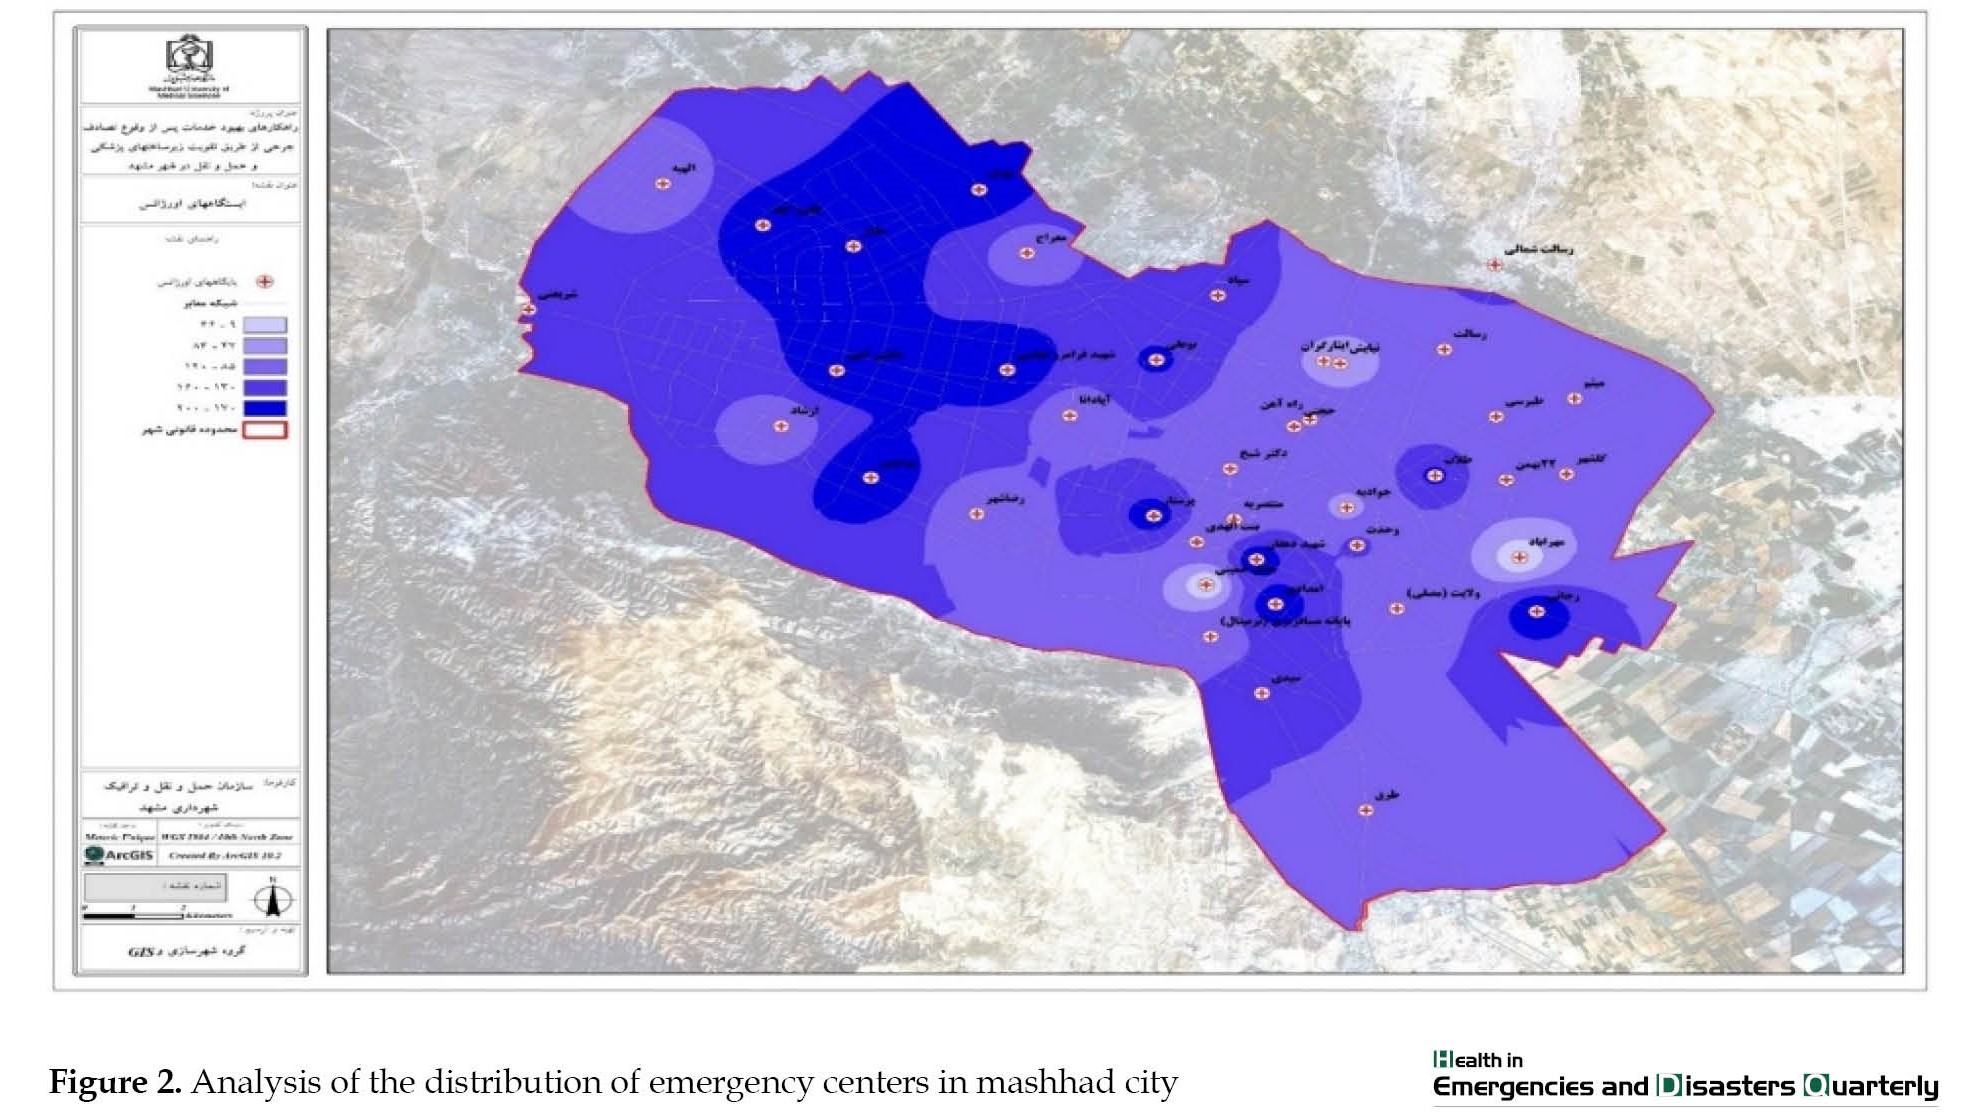
 Figure 2 shows the location of 115 emergency centers in the city, the bolder areas indicate the high density of services in terms of the number of center According to the obtained information, the accident density map and emergency spatial distribution map have been combined and overlapped in this part.
 According to Figure 3, the result is that areas marked with green color are the areas with the lowest distribution of accidents and the highest emergency services, which is considered a kind of desirability.
 In the spectrum of yellow and orange colors, the compliance of EMS with the density of accidents was appropriate, but with corrective measures, it was possible to improve the service. The red color spectrum also indicates the areas with the most accidents and the least EMS. Two critical points can be observed in Mashhad City. The first point is located on the Fajr highway and in the area of Niayesh and Isargaran bases. The second point is located on Tabarsi Street and Javadieh base.
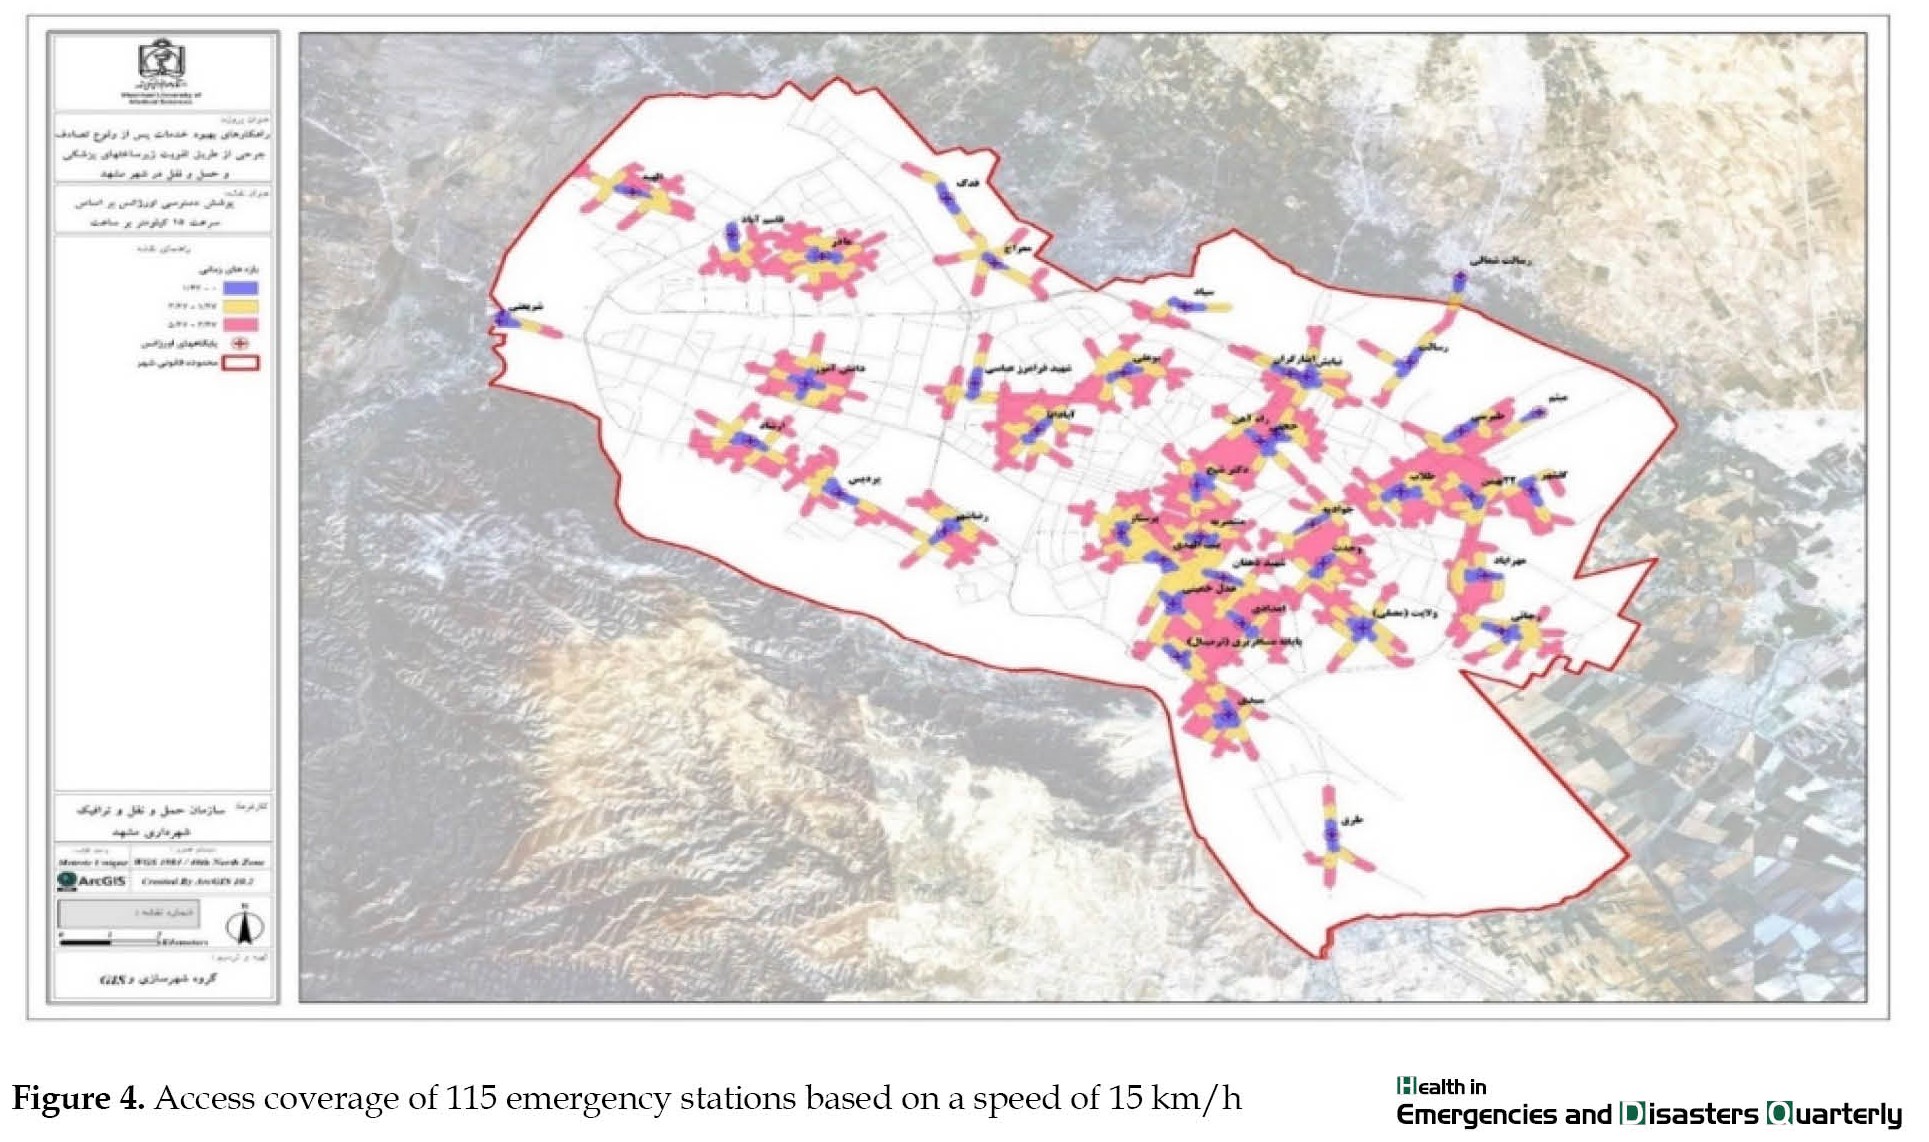
In a time radius of 1 minute and 47 seconds with an average speed of 15 km/h, 13% of all accidents (2672 missions) are covered. In the time radius from 1:47 to 3:47, another 16% of accidents (3438 missions) are covered. In the 3:47 to 5:47 radius, 28% of accidents (5394 missions) are covered. By the 5:47 interval, a total of 57% of all accidents are covered, and 43% of the 9,761 missions in the 8-minute interval cannot be covered (Figure 4).
4. Discussion
The distribution of medical services will increase the radius of service and the efficiency of medical facilities. This research attempted to investigate and identify the distribution of emergency centers in Mashhad City. According to the findings regarding the spatial compatibility of accident location with hospitals and 115 emergency centers in Mashhad City, it should be said that Panjtan axis with a very significant difference from other axes has had 288 accidents and then Tabarsi has had 143 accidents in each km of the route. For a more accurate and logical review of the number of accidents in 2013 in the axes of Mashhad City, the number of accidents for each axis has been calculated separately by mileage. This means that the number of accidents recorded in each axis is divided by its length in kilometers and the average number of accidents per kilometer is obtained. It is worth noting that the number of accidents in the first 3 axes (Tabarsi, Azadi, and Panjtan) is more than the total number of accidents in the next 7 axes. Also, the findings regarding the frequency of accidents in squares and intersections showed that Imam Hossein square, Fajr Bridge, and Abbaspour square had the highest number of accidents. According to these findings and the distribution analysis map of accident points and distribution analysis based on the density function, the eastern, central, and northeastern regions have the highest number of accidents per unit area. In addition, some points in the northwest and south of Mashhad City have a high concentration of accidents. In the eastern, central, and northeastern parts, random points have formed interconnected zones that are consistent with the traffic flows of the city. For example, the route of North Tabarsi Boulevard to the passenger terminal continuously has high accident points along the route. The transportation axes of settlements on the outskirts of Mashhad City, such as Qale Sakhtemn, Tabarsi, Tabarsi, Golshahr, Khaja Rabi, Darvi, Panjtan, Khin Arab and Resalat (Siman road) towards the city center, illustrate a pattern of repeated accidents along the way.
It shows a pattern of accident repetition along the route. In the study conducted by Nooraddin Azimi [8] in 2008, it was found that 66% of accidents happened on boulevards and streets, 14% in squares, 4% in main intersections, and 16% on other roads. It has also been determined that an average of 170 accidents have occurred per kilometer of the street, 141 accidents in squares, and, 29 accidents at intersections. Most accidents are often on the ring road and some of them extend from the city center towards the ring road and lead to the main entrance roads of the city, as well as the busy streets of the city, and generally peripheral and ring areas have had the most accidents. This study has investigated the factors of congestion and traffic accidents in the city from the perspective of the citizens of Bandar Anzali City, Iran.
The distribution map of the bases indicated that 66% of the bases in Mashhad City are located in the eastern half of Mashhad (population: 1 357 389) and only 34% of the bases are located in the western half (population: 1 408 869). Of course, due to the pilgrimage of Mashhad City, the pilgrims reside in the eastern areas of Mashhad, but again, this number of bases is inappropriately distributed to cover the entire city.
The adaptation of the spatial distribution of accidents and bases in Mashhad City showed that some parts of the city are not in a suitable condition in terms of adaptation. The first point is located on the Fajr highway and in the area of Niayesh and Isargaran bases. The second point is located on Tabarsi Street and Javadieh base. These points are located in the eastern areas of Mashhad City, and as mentioned, these areas have more bases than the western areas of Mashhad City, but the service coverage in these areas is weaker. The reason for this issue can be because the eastern areas of the city are suitable for pilgrimage and the old context and popular culture in these areas. However, Ferdowsi et al.’s study (2012) showed that the density and coverage of EMS units are higher in the west of the province and the eastern and northern areas, such as Khor and Biyabank, Naein, Ardestan, Aran and Bidgol because the extent of coverage and the allocation of resources in cities of Isfahan Province has many differences [1]. In the current study, the density and coverage of EMS units were higher in the east of the province, but in this study, the density was higher in the west of the province. According to other studies, coverage areas at different time intervals revealed that the bases could only cover 53% of accidents in less than 8 minutes, and 43% of accidents occurred in more than 8 minutes. Improper distribution of emergency bases and the wide range of areas covered by each base are the main reasons why 43% of the missions are not covered. The study conducted by Amir Ashkan Nasiripour et al. [9] showed a big difference in all the health centers and bases of Shahrekord City in terms of the largest to the smallest area covered. The north, south, and east peripheral areas have inadequate access to the city center, and 70% of the city’s health center density lacks proper distribution, which is similar to the results of this study. The study conducted by Hossein Yaghfouri et al. [10] in 2012 showed that the medical centers of Piranshahr are disproportionate in terms of compatibility with other uses and also in terms of accessibility. The southeast, north, northwest, and east parts of Piranshahr are suitable for building new clinics. In this study, the distribution of centers with therapeutic use, including hospitals, clinics, health houses, and health use, such as public baths, reservoirs, and welfare centers, were measured; however, in this study, we investigated the spatial distribution of emergency centers. According to the results of Mehrizi and Mirshojai’s study, which evaluated the pre-hospital emergency centers in the east of Tehran Province, Iran, and all the emergency centers covered by Shahid Beheshti University of Medical Sciences, it was found that the EMS and accident management center needs 130 Emergency Medical Technicians (EMT), 23 ambulance device, and an ambulance bus device to equip emergency exit stations according to pre-hospital standard regulations [6] which is similar to the results of the present study related to the shortages in resources and equipment.
5. Conclusion
The results of this research showed that the distribution of medical centers in the city was not appropriate and the access to services in different parts of the city is not equal, and this factor has caused some people to be deprived of receiving services quickly and on time. According to the investigations, the inappropriate distribution bases and hospitals in Mashhad City can decrease in the desired level of access and create illogical concentration. To cover the emergency missions, it is necessary to set up new emergency bases in the areas that are not covered by the standard time radius and to equip the pre-hospital emergency bases, especially Javadiyeh, Niayesh, and Isargaran bases. Also, Mashhad hospitals should be completed and strengthened. In addition to the 4 main trauma service hospitals, 9 other hospitals that are outside the time radius of the existing hospitals can be added to this network if the trauma department is strengthened or established. By drawing the time radius of 12 minutes of the mentioned hospitals, it is possible to identify the areas that need to build a new trauma center.
Ethical Considerations
Compliance with ethical guidelines
All ethical considerations are considered.
Funding
This research has not received any institutional financial support.
Authors' contributions
All authors contributed equally to the preparation of this article.
Conflict of interest
The authors declared no conflict of interest.
Acknowledgments
The researcher expresses his gratitude to the colleagues of the Mashhad pre-hospital emergency department who have cooperated in data collection and analysis, especially Engineer Ebadi.
References
Providing emergency medical services is one of the crucial aspects of patient treatment. Since the provision of accurate and fast services in emergencies can lead to the survival of patients, it is highly valuable [1]. Pre-hospital Emergency Medical services (EMS) is the first treatment level provided by Emergency Medical Technicians (EMTs) and rescuers to patients suffering from life-threatening conditions before delivery to the hospital. EMS seeks to reduce response time. This time is known between an emergency call made to an ambulance station and the time when an ambulance dispatched to assist arrives at the scene and a shorter response time improves survival [2]. Response time is a vital factor in determining the quality of pre-hospital EMS. This time is also called the golden time because the percentage of survival of patients who were treated within the first hour of visiting the hospital is higher than that of patients who waited longer [3].
The time it takes to get to the patient’s bedside is also an effective barrier for service providers. Access to services is defined as the ability of people to use services at any time and place. Due to the importance of access, the decisions taken in the health service system are influenced by the quality of services available in different places, at different times, the cost of services, and the ease of access to services [4].
The issue of access to urban services is one of the vital issues that affects the economy of the city from various dimensions. In other words, the inappropriate distribution of service users, in addition to spending high transportation and fuel costs to access them, wastes citizens’ time and creates traffic jams, and results in costs that cannot be calculated most of the time. Also, sometimes the lack of proper access to some applications exposes people’s health to risk. Healthcare services are an example of this type, which requires timely and appropriate access for all members of society [5]. In this regard, the Geographic Information System (GIS) examines the geographic dimension of access. GIS measures geographic access more accurately and analyzes geographic disparities in access to services [4]. The use of this system is considered the best tool for decision-making in crisis management, according to the capabilities of GIS data integration and the possibility of complex analysis of spatial and non-spatial data. In addition, GIS can be used to locate pre-hospital emergency bases before a crisis and identify high-risk areas during accidents [6].
Health and medical indicators are the vital indicators of development showing that geographical distribution and development are unevenly taking place [7]; Therefore, with the awareness of the importance of knowing the current situation of societies and geographical environments to planning optimally for the future, and considering the importance and necessity of developing health indicators, as the most basic and basic needs of any healthy society, the present research seeks to measure the distribution of emergency centers in Mashhad City in 2014.
2. Materials and Methods
The present study is descriptive-cross-sectional and applied. The studied population for the high-accident areas of Mashhad City includes 21142 missions carried out in 2014. The research environment is the medical emergency and accident management center of Khorasan Razavi Province, Iran, and the information needed by the researcher was collected by receiving the injured files from the statistics unit of the center. In the survey of the high-accident areas of Mashhad City, the files of the injured were examined as the census. According to the information available in the files of the injured, 21142 accidents resulting in injuries were recorded in 2013. After collecting the available addresses from the files, they were entered into the GIS spatial analysis software, the desired information was analyzed, and its numerical information was produced. To analyze spatial data using the inverse distance weighting method, which is based on inverse distances, the distribution of stations has been analyzed according to their area. Time coverage of emergency centers has been performed based on network analysis in the GIS software environment.
Time coverage is the range in which, despite traffic restrictions during peak hours, the ambulance can reach the accident site in standard time. Ambulance movement is considered in this analysis based on the road network. The average speed of an ambulance during peak traffic is considered to be 15 km/h. The periods considered in this analysis are equal to 4, 6, and 8 minutes. According to the reports received from the emergency medical center of Mashhad University of Medical Sciences, the time interval from the moment of calling the center 115 to the ambulance leaving the base is 2 minutes and 23 seconds. As a result, the time taken by the ambulance to leave the base and arrive at the accident site is 1:47, 3:47, and 5:47. By forming the database of the road network of Mashhad City in the GIS environment as communication links and defining emergency centers as facility, the radius of emergency centers was drawn on the road network of Mashhad using the service area method.
3. Results
Regarding the distribution of accidents in Mashhad City, the Panjtan axis with a very significant difference from other axes has had 288 accidents per kilometer of the route, followed by 143 and 95 accidents per kilometer in Tabarsi and Azadi, respectively. According to the surveys conducted on the frequency of accidents in squares and intersections, Imam Hossein square, Fajr Bridge, and Abbaspur square had the highest number of accidents in 2014. The number of accidents in these three squares on average (118 accidents) is almost twice the average of other squares (65 accidents).
It can be said that the transportation axes of settlements on the outskirt of Mashhad City, such as Qale Sakhteman, Tabarsi, Golshahr, Khaje Rabi, Darvi, Panjtan, Khin Arab, and Resalat (Siman Road) towards the city center show a pattern of repetition of accidents along the way (Figure 1).
In a time radius of 1 minute and 47 seconds with an average speed of 15 km/h, 13% of all accidents (2672 missions) are covered. In the time radius from 1:47 to 3:47, another 16% of accidents (3438 missions) are covered. In the 3:47 to 5:47 radius, 28% of accidents (5394 missions) are covered. By the 5:47 interval, a total of 57% of all accidents are covered, and 43% of the 9,761 missions in the 8-minute interval cannot be covered (Figure 4).
4. Discussion
The distribution of medical services will increase the radius of service and the efficiency of medical facilities. This research attempted to investigate and identify the distribution of emergency centers in Mashhad City. According to the findings regarding the spatial compatibility of accident location with hospitals and 115 emergency centers in Mashhad City, it should be said that Panjtan axis with a very significant difference from other axes has had 288 accidents and then Tabarsi has had 143 accidents in each km of the route. For a more accurate and logical review of the number of accidents in 2013 in the axes of Mashhad City, the number of accidents for each axis has been calculated separately by mileage. This means that the number of accidents recorded in each axis is divided by its length in kilometers and the average number of accidents per kilometer is obtained. It is worth noting that the number of accidents in the first 3 axes (Tabarsi, Azadi, and Panjtan) is more than the total number of accidents in the next 7 axes. Also, the findings regarding the frequency of accidents in squares and intersections showed that Imam Hossein square, Fajr Bridge, and Abbaspour square had the highest number of accidents. According to these findings and the distribution analysis map of accident points and distribution analysis based on the density function, the eastern, central, and northeastern regions have the highest number of accidents per unit area. In addition, some points in the northwest and south of Mashhad City have a high concentration of accidents. In the eastern, central, and northeastern parts, random points have formed interconnected zones that are consistent with the traffic flows of the city. For example, the route of North Tabarsi Boulevard to the passenger terminal continuously has high accident points along the route. The transportation axes of settlements on the outskirts of Mashhad City, such as Qale Sakhtemn, Tabarsi, Tabarsi, Golshahr, Khaja Rabi, Darvi, Panjtan, Khin Arab and Resalat (Siman road) towards the city center, illustrate a pattern of repeated accidents along the way.
It shows a pattern of accident repetition along the route. In the study conducted by Nooraddin Azimi [8] in 2008, it was found that 66% of accidents happened on boulevards and streets, 14% in squares, 4% in main intersections, and 16% on other roads. It has also been determined that an average of 170 accidents have occurred per kilometer of the street, 141 accidents in squares, and, 29 accidents at intersections. Most accidents are often on the ring road and some of them extend from the city center towards the ring road and lead to the main entrance roads of the city, as well as the busy streets of the city, and generally peripheral and ring areas have had the most accidents. This study has investigated the factors of congestion and traffic accidents in the city from the perspective of the citizens of Bandar Anzali City, Iran.
The distribution map of the bases indicated that 66% of the bases in Mashhad City are located in the eastern half of Mashhad (population: 1 357 389) and only 34% of the bases are located in the western half (population: 1 408 869). Of course, due to the pilgrimage of Mashhad City, the pilgrims reside in the eastern areas of Mashhad, but again, this number of bases is inappropriately distributed to cover the entire city.
The adaptation of the spatial distribution of accidents and bases in Mashhad City showed that some parts of the city are not in a suitable condition in terms of adaptation. The first point is located on the Fajr highway and in the area of Niayesh and Isargaran bases. The second point is located on Tabarsi Street and Javadieh base. These points are located in the eastern areas of Mashhad City, and as mentioned, these areas have more bases than the western areas of Mashhad City, but the service coverage in these areas is weaker. The reason for this issue can be because the eastern areas of the city are suitable for pilgrimage and the old context and popular culture in these areas. However, Ferdowsi et al.’s study (2012) showed that the density and coverage of EMS units are higher in the west of the province and the eastern and northern areas, such as Khor and Biyabank, Naein, Ardestan, Aran and Bidgol because the extent of coverage and the allocation of resources in cities of Isfahan Province has many differences [1]. In the current study, the density and coverage of EMS units were higher in the east of the province, but in this study, the density was higher in the west of the province. According to other studies, coverage areas at different time intervals revealed that the bases could only cover 53% of accidents in less than 8 minutes, and 43% of accidents occurred in more than 8 minutes. Improper distribution of emergency bases and the wide range of areas covered by each base are the main reasons why 43% of the missions are not covered. The study conducted by Amir Ashkan Nasiripour et al. [9] showed a big difference in all the health centers and bases of Shahrekord City in terms of the largest to the smallest area covered. The north, south, and east peripheral areas have inadequate access to the city center, and 70% of the city’s health center density lacks proper distribution, which is similar to the results of this study. The study conducted by Hossein Yaghfouri et al. [10] in 2012 showed that the medical centers of Piranshahr are disproportionate in terms of compatibility with other uses and also in terms of accessibility. The southeast, north, northwest, and east parts of Piranshahr are suitable for building new clinics. In this study, the distribution of centers with therapeutic use, including hospitals, clinics, health houses, and health use, such as public baths, reservoirs, and welfare centers, were measured; however, in this study, we investigated the spatial distribution of emergency centers. According to the results of Mehrizi and Mirshojai’s study, which evaluated the pre-hospital emergency centers in the east of Tehran Province, Iran, and all the emergency centers covered by Shahid Beheshti University of Medical Sciences, it was found that the EMS and accident management center needs 130 Emergency Medical Technicians (EMT), 23 ambulance device, and an ambulance bus device to equip emergency exit stations according to pre-hospital standard regulations [6] which is similar to the results of the present study related to the shortages in resources and equipment.
5. Conclusion
The results of this research showed that the distribution of medical centers in the city was not appropriate and the access to services in different parts of the city is not equal, and this factor has caused some people to be deprived of receiving services quickly and on time. According to the investigations, the inappropriate distribution bases and hospitals in Mashhad City can decrease in the desired level of access and create illogical concentration. To cover the emergency missions, it is necessary to set up new emergency bases in the areas that are not covered by the standard time radius and to equip the pre-hospital emergency bases, especially Javadiyeh, Niayesh, and Isargaran bases. Also, Mashhad hospitals should be completed and strengthened. In addition to the 4 main trauma service hospitals, 9 other hospitals that are outside the time radius of the existing hospitals can be added to this network if the trauma department is strengthened or established. By drawing the time radius of 12 minutes of the mentioned hospitals, it is possible to identify the areas that need to build a new trauma center.
Ethical Considerations
Compliance with ethical guidelines
All ethical considerations are considered.
Funding
This research has not received any institutional financial support.
Authors' contributions
All authors contributed equally to the preparation of this article.
Conflict of interest
The authors declared no conflict of interest.
Acknowledgments
The researcher expresses his gratitude to the colleagues of the Mashhad pre-hospital emergency department who have cooperated in data collection and analysis, especially Engineer Ebadi.
References
- Ferdosi M, Yarmohammadian MH, Karimi S, Rastin G, Artang M, Mohammadi F, Mofid M, Rejalian F. Spatial distribution of prehospital emergency medical services bases in Isfahan province in 2012 using GIS. International Journal of Health System and Disaster Management. 2013; 1(3):184.[DOI:10.4103/2347-9019.129184]
- Mahama MN, Kenu E, Bandoh DA, Zakariah AN. Emergency response time and pre-hospital trauma survival rate of the national ambulance service, Greater Accra (January–December 2014). BMC Emergency Medicine. 2018; 18:1-7.[DOI:10.1186/s12873-018-0184-3] [PMID] [PMCID]
- Peleg K, Pliskin JS. A geographic information system simulation model of EMS: reducing ambulance response time. The American Journal of Emergency Medicine. 2004; 22(3):164-70.[DOI:10.1016/j.ajem.2004.02.003] [PMID]
- McLafferty SL. GIS and health care. Annual Review of Public Health. 2003; 24(1):25-42. [DOI:10.1146/annurev.publhealth.24.012902.141012] [PMID]
- Rahnama MR, Amirfakhriyan M. Analysis of spatial access to healthcare services in Mashhad city. Physical Social Planning. 2013; 1(3):61-74. [Link]
- Mollamohammad Alian Mehrizi Z, Mirshojaee SA. Spatial analysis of pre-hospital emergency bases in disasters in Tehran Province, Iran. Quarterly Scientific Journal of Rescue and Relief. 2021; 13(1):61-77. [DOI:10.32592/jorar.2021.13.1.7]
- Mohammadi J, Ahmadian M, Alizadeh J, Jamini D. Spatial analysis of health and sanitary indicators of western Azerbaijan. Social Welfare Quarterly. 2013; 12(47):153-80. [Link]
- MolaeiHashjin N, Azimi NA, Ghorbani M. [A study of crowding and intra-city traffic accidents factors In citizens' views in City of Bandar Anzali (Persian)]. Journal of Studies of Human Settlements Planning. 2012; 7(20):30-42. [Link]
- Nasiripour AA, Raeissi P, Asgari A. Analysis of the spatial distribution of health care centers of Shahrekord by geographical information system. Journal of Shahrekord University of Medical Sciences. 2015; 16(6):19-21. [Link]
- Yaghfuri H, Kashefi-doos D, Ghader-marzi G. [Analysis of the pattern of health centers distribution and locating new clinics (Case Study: Piranshahr) (Persian)]. Journal of Environmental Logistics. 2004; 7(25):129-48. [Link]
Type of article: Research |
Subject:
Special
Received: 2021/06/9 | Accepted: 2022/05/29 | Published: 2023/04/18
Received: 2021/06/9 | Accepted: 2022/05/29 | Published: 2023/04/18
Send email to the article author
| Rights and permissions | |
 |
This work is licensed under a Creative Commons Attribution-NonCommercial 4.0 International License. |

Copyright © The Author(s);
This is an open access article distributed under the terms of the Creative Commons Attribution-NonCommercial 4.0 (CC-By-NC 4.0), which permits use, distribution, and reproduction in any medium, provided the original work is properly cited and is not used for commercial purposes.
Contact Information
This is an open access article distributed under the terms of the Creative Commons Attribution-NonCommercial 4.0 (CC-By-NC 4.0), which permits use, distribution, and reproduction in any medium, provided the original work is properly cited and is not used for commercial purposes.
Contact Information
