

Volume 9, Issue 4 (Summer 2024)
Health in Emergencies and Disasters Quarterly 2024, 9(4): 255-264 |
Back to browse issues page


Download citation:
BibTeX | RIS | EndNote | Medlars | ProCite | Reference Manager | RefWorks
Send citation to:


BibTeX | RIS | EndNote | Medlars | ProCite | Reference Manager | RefWorks
Send citation to:
Askari A, Hosseinpour R, Bakhtiari M, Sepehr P, Ghodrati Torbati A, Salehi Sahlabadi A, et al . Investigating the Relationship Between Subjective and Interpretive drowsiness With Lane Departure in Simulator Driving. Health in Emergencies and Disasters Quarterly 2024; 9 (4) :255-264
URL: http://hdq.uswr.ac.ir/article-1-521-en.html
URL: http://hdq.uswr.ac.ir/article-1-521-en.html
Ali Askari1 

 , Robab Hosseinpour2 , Mohammad Bakhtiari3 , Parvin Sepehr4 , Abbas Ghodrati Torbati5 , Ali Salehi Sahlabadi6 , Maliheh Eshaghzadeh7 , Anahita Zandi7 , Javad Vatani * 8, Mohsen Poursadeghiyan9
, Robab Hosseinpour2 , Mohammad Bakhtiari3 , Parvin Sepehr4 , Abbas Ghodrati Torbati5 , Ali Salehi Sahlabadi6 , Maliheh Eshaghzadeh7 , Anahita Zandi7 , Javad Vatani * 8, Mohsen Poursadeghiyan9
1- Department of Occupational Health, School of Public Health, Tehran University of Medical Sciences, Tehran, Iran.
2- Students Research Committee, Faculty of Health, Ardabil University of Medical Sciences, Ardabil, Iran.
3- Department of Anesthesiology, Sirjan school of Medical Sciences, Sirjan, Iran.
4- Students Research Committee, Department of Occupational Health and Safety at Work, School of Public Health and Safety, Shahid Beheshti University of Medical Sciences, Tehran, Iran.
5- Department of Nursing, school of Nursing and Midwifery, Torbat Heydariyeh University of Medical Sciences, Torbat Heydariyeh, Iran.
6- Department of Occupational Health and Safety at Work, School of Public Health and Safety, Shahid Beheshti University of Medical Sciences, Tehran, Iran.
7- Department of Nursing, School of Nursing and Midwifery, Torbat Heydariyeh University of Medical Sciences, Torbat Heydariyeh, Iran.
8- Department of Occupational Health Engineering, Guilan Road Trauma Research Center, School of Health, Guilan University of Medical Sciences, Rasht, Iran. ,jvatani@gmail.com
9- Social Determinants of Health Research Center, Faculty of Health, Ardabil University of Medical Sciences, Ardabil, Iran.
2- Students Research Committee, Faculty of Health, Ardabil University of Medical Sciences, Ardabil, Iran.
3- Department of Anesthesiology, Sirjan school of Medical Sciences, Sirjan, Iran.
4- Students Research Committee, Department of Occupational Health and Safety at Work, School of Public Health and Safety, Shahid Beheshti University of Medical Sciences, Tehran, Iran.
5- Department of Nursing, school of Nursing and Midwifery, Torbat Heydariyeh University of Medical Sciences, Torbat Heydariyeh, Iran.
6- Department of Occupational Health and Safety at Work, School of Public Health and Safety, Shahid Beheshti University of Medical Sciences, Tehran, Iran.
7- Department of Nursing, School of Nursing and Midwifery, Torbat Heydariyeh University of Medical Sciences, Torbat Heydariyeh, Iran.
8- Department of Occupational Health Engineering, Guilan Road Trauma Research Center, School of Health, Guilan University of Medical Sciences, Rasht, Iran. ,
9- Social Determinants of Health Research Center, Faculty of Health, Ardabil University of Medical Sciences, Ardabil, Iran.
Keywords: Lane crossing (LC), Karolinska sleepiness scale (KSS), observer rating of drowsiness (ORD), Standard deviation of lane position (SDLP), Drowsiness, Driving crashes, Transportation safety
Full-Text [PDF 733 kb]
(76 Downloads)
| Abstract (HTML) (540 Views)
Full-Text: (21 Views)
Introduction
Drowsiness, fatigue, distracted driving, and an inability to properly control the vehicle on a safe path are important factors that can significantly contribute to road accidents [1]. In recent years, driver drowsiness has been a common reason for road accidents, leading to physical harm, death, and considerable economic losses [2]. The America National Highway Traffic Safety Administration (NHTSA) estimates that in 2017, a total of 91000 police-reported crashes involved drowsy drivers, resulting in an estimated 50000 injuries and nearly 800 deaths [3]. According to the US National Safety Council (NHTSA), drowsy driving is responsible for approximately 100000 incidents on the roads each year. These accidents result in about 71000 injuries and 1550 deaths [4]. Meanwhile, driver drowsiness is a factor in 10% to 20% of motor vehicle accidents [5]. The German Road Safety Organization (DGUV) states that about 25% of human-caused road accidents are a direct result of driver drowsiness on highways [6]. The negative effects of drowsiness on driving are apparent and it is important to study and understand drivers’ behaviors during drowsiness [7]. The American Academy of Sleep Medicine (AASM) encourages more research to better define indicators of drowsy driving and identify the threshold at which sleepiness while driving becomes dangerous [8]. Continuous and long hours of driving in monotonous circumstances at night and early in the morning are reasons for driver drowsiness and a decrease in driver’s performance [9]. The effects of drowsiness on driving can vary from person to person, and there is no set period for when drowsiness can begin to affect driving. However, according to research by America Centers for Disease Control and Prevention, drowsiness can impair a driver’s ability to pay attention to the road, slow their reaction time, and affect their decision-making abilities [10]. Based on the study by Mabry et al. [11], drowsiness and fatigue can affect a person’s coordination, reaction time, focus, judgment, and memory, which are all necessary for safe driving. Mascord [12] confirms that at different levels of drowsiness, physiological provocation decreases and slow intuitive performances and subsequently defective processing of information will decrease the driver’s responses to stimuli from the environment, unusual circumstances and emergencies. Sleepiness, drowsiness and fatigue are used interchangeably in scientific literature to describe the impaired state caused by the lack of sleep. However, fatigue can have multiple causes, like physical exertion or mental workload. On the other hand, sleepiness and drowsiness refer to the condition induced by sleep loss only [5]. Based on the study by Poursadeghiyan et al. [13], driving between lines and preventing line crossing are principal efforts that are affected by driver’s drowsiness. Therefore, the standard deviation of lane position (SDLP) is a sign of drowsiness [14]. Driving for a long time on monotonous roads can cause fatigue in drivers [13]. As a result, a fatigued driver crosses lines frequently [13, 15]. However, based on a conducted study by Higgins et al. [16], drowsy driving accidents can be prevented by using various methods, such as public awareness campaigns, developing drowsiness detection technologies, implementing hours of service regulations and fatigue risk management for commercial drivers, and introducing laws to prosecute and deter dangerous driving due to fatigue. However, the success of some of these interventions has been variable [5]. Additionally, since scientists do not agree on whether drivers are accurately aware of their drowsiness when driving has significant implications for legal proceedings related to crashes caused by drivers falling asleep behind the wheel [5, 17]. Hence, factors such as the importance of road crashes, the significant role of drowse driving, the varied success of prevention measures, and the high cost of technology in cars used, especially in poor and developing countries, along with the lack of access to higher safety vehicles should be considered. Therefore, the current study is conducted in the Khajeh-Nasir Tosi University Applied Design Laboratory to explore the relationship between subjective and interpretive drowsiness and going off-road in a driving simulator.
Materials and Methods
This experimental study was carried out in Khajeh-Nasir Tosi University Applied Design Laboratory in 2022. A total of 34 men aged 18 to 50 years were randomly selected from the suburbs. They had healthy eyes (no glasses) and normal physical appearance (no long beards or mustaches). The criterion for entering the study included having healthy drivers who are not addicted and do not consume caffeine. In addition, those who did not become severely drowsy during 2 h of continuous driving to the point of deviating from the road were excluded from the study.
Description of the experiments condition
To determine the level of drowsiness and record the driver’s images, a virtual-reality driving simulator was utilized in a fixed temperature and acoustic-controlled and calm room [18]. The participants began driving to detect drowsiness by analyzing facial features. They were noticed to neglect the unrealities of the test and driving the simulator according to traffic regulations. The drivers also drove the simulator tentatively before the test. In this research to provide real conditions of driving a Scania BI 301 simulator (Figure 1) was designed.
 The driving simulator used in this study can automatically simulate park, reverse and forward gears, as well as display all the gauges on the dashboard virtually. Three 3D projectors and a 180-degree half-cylindrical screen in front of the windshield and two 18’ Liquid-crystal-display televisions (LCD TVs) operate as side mirrors and a 17’ LCD TV operates as the back mirror
The virtual road simulated in the research was a loop with the least side components and the minimum curvatures to induce fatigue. Finally, by matching and synchronizing this data and the data available in libraries and previous studies, the initial model of dynamic facial changes was developed.
Vehicle performance data recording
The device records the data of every frame when it renders the frame; therefore, the rate of sampling is not constant and ranges between 90 Hz to 350 Hz. To suppress these changes, by utilizing linear correlation, the rate of 100 Hz is determined as the rate of sampling. Then, by using the data on the location of the vehicle and information on the side-road lines, the distance between the center of the vehicle and the side-road line is calculated and saved in the output of the device.
Driver selection
In the study, 25 drivers were selected. The criteria were that they should be physically normal with no long beards or moustaches and should have no drug addiction or brain damage. Also, they should not have consumed caffeine-containing drugs foods, or cigarettes for 12 h before the study. In addition, their sleep patterns for a week were assessed using checklists. Both criteria were closely monitored.
Experiment protocol
As the test begins, the driver starts driving on a monotonous road at the speed of 110 km/h for 2 h. A camera takes the driver’s face images by the Karolinska sleepiness scale (KSS) [19] simulated on the road, and appeared once every 10 min. Also, according to the observer rating of drowsiness (ORD) [19], the level of drowsiness was determined by the observer every 10 min. Whole devices, such as the camera and simulator were checked to prevent unexpected ceases in this step of the test. The observer finished the test when the vehicle left the road completely.
Record of ORD, KSS, SDLP and lane crossing (LC) in driving test
In this research, the average ORD, as an objective determination of drowsiness and facial changes is determined according to the review of the video while driving every 10 min, by the observer, KSS criteria as a subjective estimation of sleepiness, displayed 12 times during 120 min on the road monitor screen and the driver must answer it [18]. SDLP approach calculates the deviation of the vehicle’s position from the lane’s center [20]. The LC or lane change criterion reports the number of crossings on the side of the road by the observer in a 10 min period and by observing the road video while driving [21]. Finally, to check the correlation between ORD and KSS during driving by employing the number of line crossings on both sides of the road and changes in the lateral position of the vehicle, repeated measure multivariate analysis of variance was employed. Then, a significant correlation between ORD and KSS, or the number of line crossings and the level of lateral position changes was observed. For every dependent variable variance analysis test with repeated measures and to obtain an appropriate model by considering events in time, the interaction test was conducted for every factor.
Results
Statistical survey on the correlation between ORD and KSS
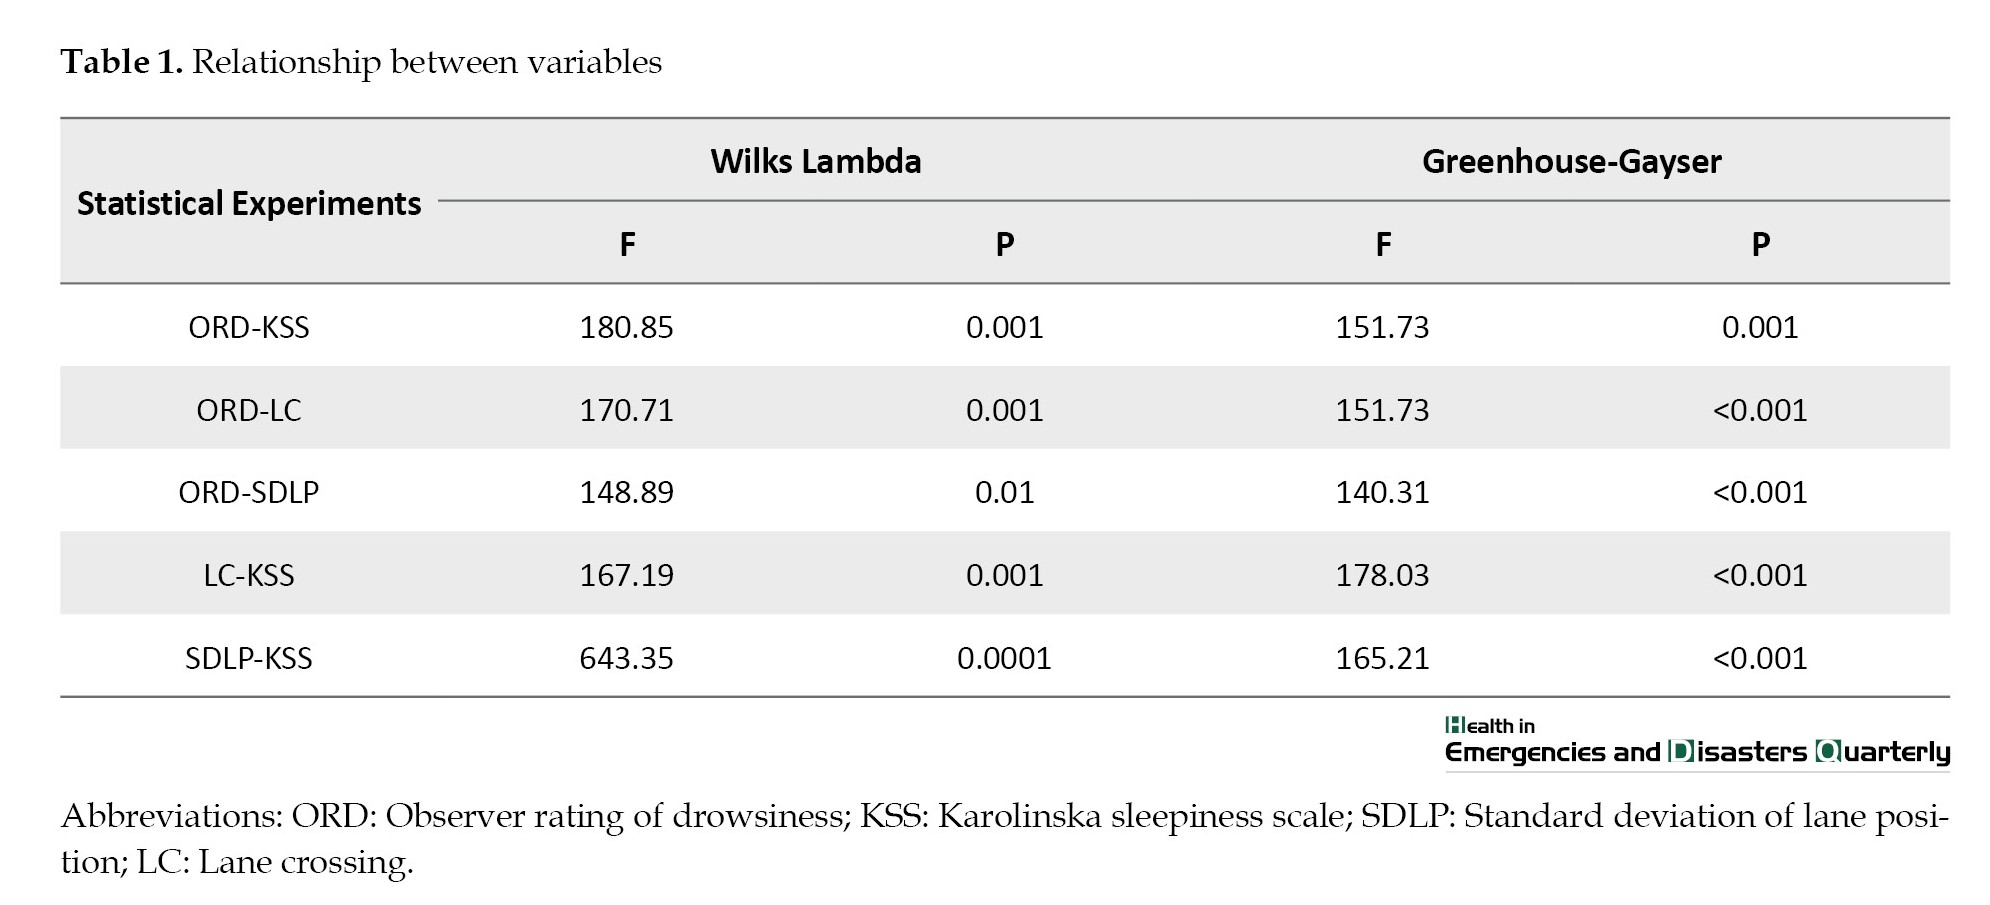
The results of the multiple variable tests showed that the time variable significantly affects ORD and KSS. Specifically, the combined linear regression of the two dependent variables throughout the 12-period research exhibited a significant difference (F=180.85, P=0.001).
Given that the assumption of independence for the two variables was not maintained after being evaluated using the Mauchly test (P<0.05). Meanwhile, the Greenhouse-Gayser test showed that the variable of KSS exhibited significant changes across the twelve research periods (F=178.3, P=0.001).
The Greenhouse-Gayser test also reported a significant difference at the 5% error level for the ORD variable within the study period. Specifically, the results of the test were F=151.73 and P=0.001 (Figure 2 and Table 1).

Statistical survey on the correlation between ORD and LC
The results of the multiple variable tests showed that the time variable significantly affects ORD and LC. Specifically, the combined linear regression of the two dependent variables throughout the 12-period research exhibited a significant difference (F=170.71, P=0.001).
Given that the assumption of independence for the two variables was not maintained after being evaluated using the Mauchly test (P<0.05), the Greenhouse-Gayser test showed that the variable of LC exhibited significant changes across the twelve research periods (F=4.05, P=0.02).
The Greenhouse-Gayser test also reported a significant difference at the 5% error level for the ORD variable within the study period. Specifically, the results of the test were F=151.73, P=0.001 (Figure 3 and Table 1).
Statistical survey on the correlation between ORD and SDLP
The results of the multiple variable tests showed that the time variable significantly affects ORD and SDLP. Specifically, the combined linear regression of the two dependent variables throughout the 12-period research exhibited a significant difference (F=148.89, P=0.001).
Given that the assumption of independence for the two variables was not maintained after being evaluated using the Mauchly test (P<0.05). The Greenhouse-Gayser test showed that the variable of ORD exhibited significant changes across the twelve research periods (F=140.31, P=0.001).
The Greenhouse-Gayser test also failed to show a significant difference at the 5% error level for the SDLP variable within the study period. Specifically, the results of the test were F=3.17 and P=0.052 (Figure 4 and Table 1).
Statistical survey on the correlation between LC and KSS
The results of multiple variable tests showed that the time variable significantly affects KSS and LC. Specifically, the combined linear regression of the two dependent variables throughout the 12-period research exhibited a significant difference (F=167.19, P=0.001).
Given that the assumption of independence for the two variables was not maintained after being evaluated using the Mauchly test (P<0.05). The Greenhouse-Gayser test showed that the variable of LC exhibited significant changes across the twelve research periods (F=4.05, P=0.001).
The Greenhouse-Gayser test also reported a significant difference at the 5% error level for the ORD variable within the study period. Specifically, the results of the test were F=178.3 and P=0.001 (Figure 5 and Table 1).
Statistical survey on the correlation between SDLP and KSS
The results of multiple variable tests showed that the time variable significantly affects KSS and SDLP. Specifically, the combined linear regression of the two dependent variables throughout the 12-period research exhibited a significant difference (F=643.35, P=0.002).
Given that the assumption of independence for the two variables was not maintained after being evaluated using the Mauchly test (P<0.05). the Greenhouse-Gayser test showed that the variable of KSS exhibited significant changes across the twelve research periods (F=165.21, P=0.002).
The Greenhouse-Gayser test also failed to show a significant difference at the 5% error level for the SDLP variable within the study period. Specifically, the results of the test were F=3.17 and P=0.047 (Figure 6 and Table 1).

Discussion
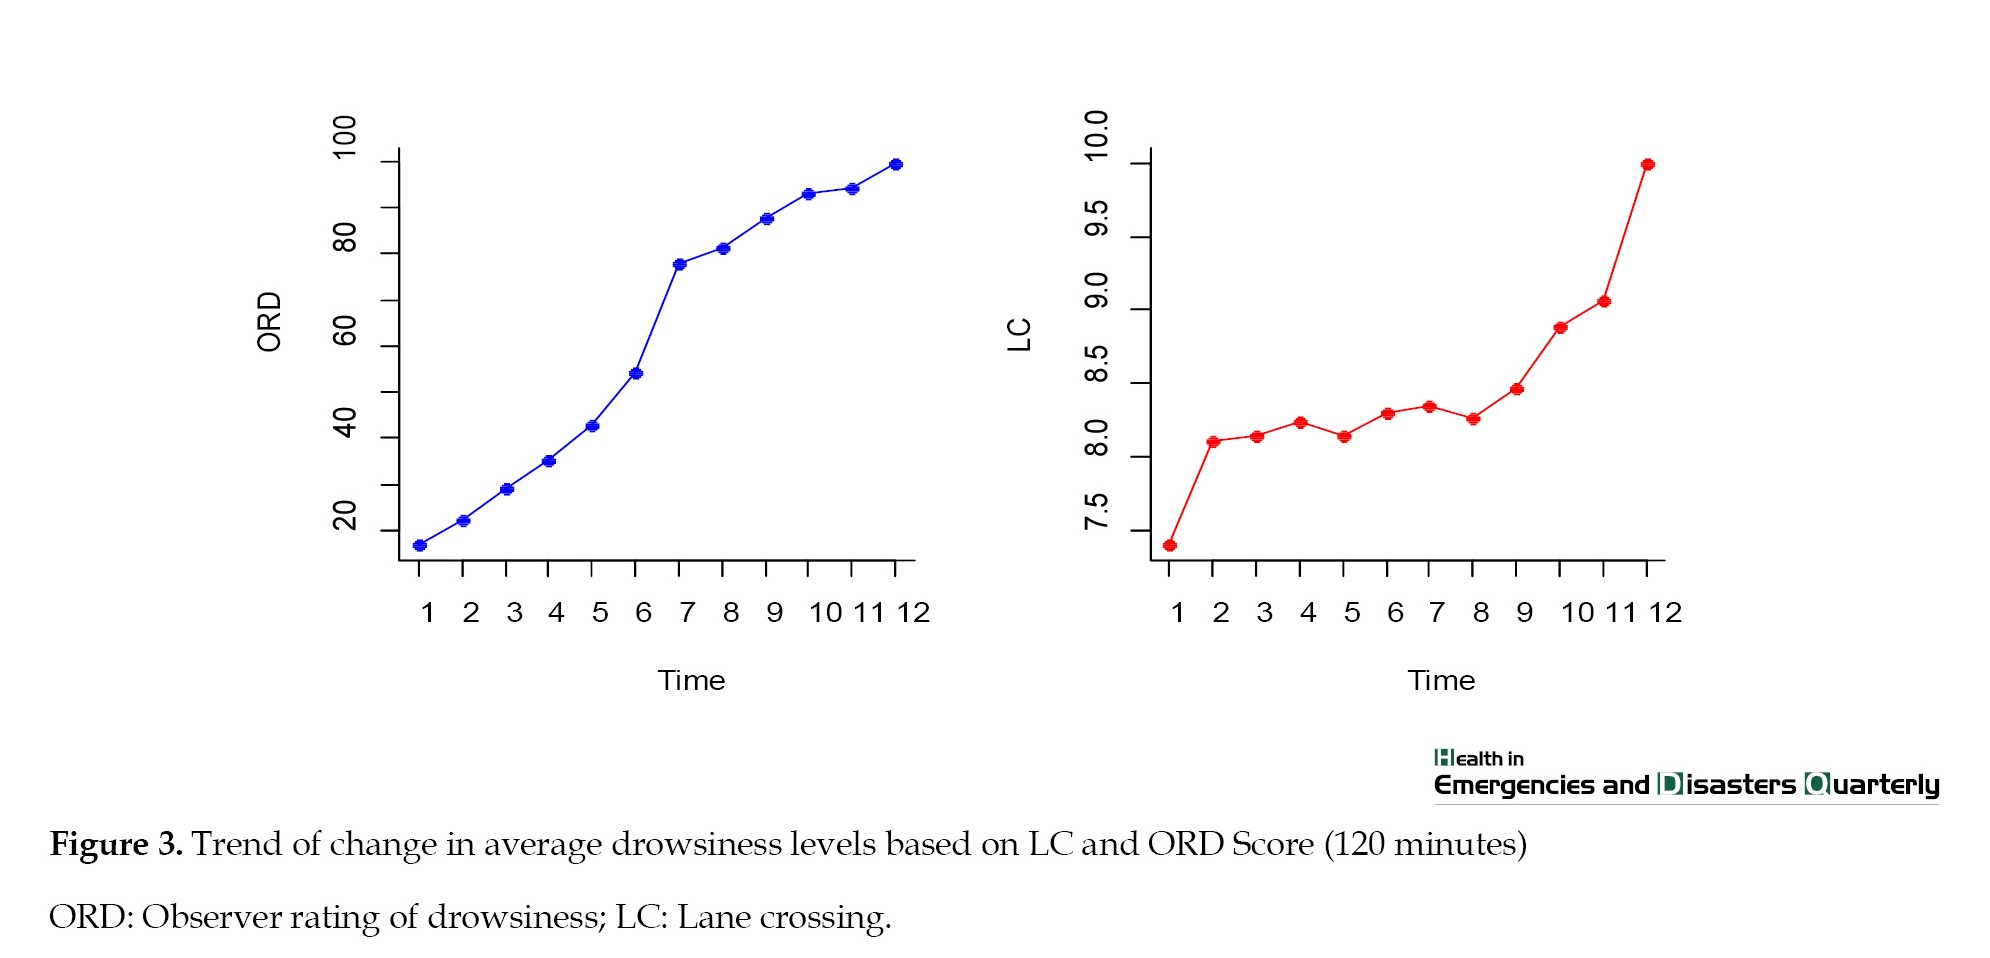
According to Figure 2, the ORD and KSS indices have an almost similar upward trend during the 120 min of monitoring. The upward trend of these scales occurred at a faster rate between 60 and almost 70 min. The study by Uchiyama et al. [22] found that there are significant positive correlations between the levels of ORD and all other forms of drowsiness, such as subjective self-rating (KSS scores). This indicates an association between objective drowsiness (determined by ORD measurements) and perceived sleepiness (from the KSS scores). The study results by Poursadeghiyan et al. [19] found a significant correlation between the measurement trends of drowsiness levels using KSS and ORD scales, suggesting a connection between both scales. Moreover, the study found that there is a link between the dynamics of mouth movements during the test and drowsiness levels (as measured by KSS and ORD). While this research did not provide specific details on the strength or consistency of the correlation between ORD and KSS, it indicates that there is a significant relationship between the two measures of drowsiness. Figure 3 shows that the mean of changes in drowsiness according to the number of line crossings increases as time progresses and in minutes 50 and 80, two fluctuations were observed but changes had an upward trend. These fluctuations are related to the differences in driving among different drivers [23]. The general upward trend is because of an increase in the level of drowsiness and number of line crossings [24]. The trend of changes in drowsiness shows that in the first thirty minutes of driving, KSS has a gradual upward trend. There is a moderate increase in this trend from minute 30 to minute 80. Then, it slowly increases from minute 80 to minute 120. These different trends can be interpreted as follows. In the first 30 min of driving, drivers confess to the impression of drowsiness on the driving errors, because at the beginning of driving, they do not feel drowsiness or are not drowsy. Then, by minute 80, drivers admit to the drowsiness by answering to KSS questionnaire. Drowsiness exists after minute 80. However, the rate of drowsiness in this period has a slow increase. This may be due to omitting some drivers from the test by lane deviation or line crossing. Nevertheless, this upward trend continues as time progresses [25]. Poursadeghiyan et al. [19], using artificial neural network models, found that the number of line crossings was one of the factors used to detect and predict driver drowsiness. In addition, the study by Jacobé de Naurois et al. [15] found that ORD relies on a persistent scale from “alert” to “extremely drowsy” with a list of criteria that can be observable in the driver, including the number of line crossings. Another study by Akerstedt et al. [23] and Sandberg et al. [26] also confirmed that KSS scores were significantly correlated with the number of line crossings.
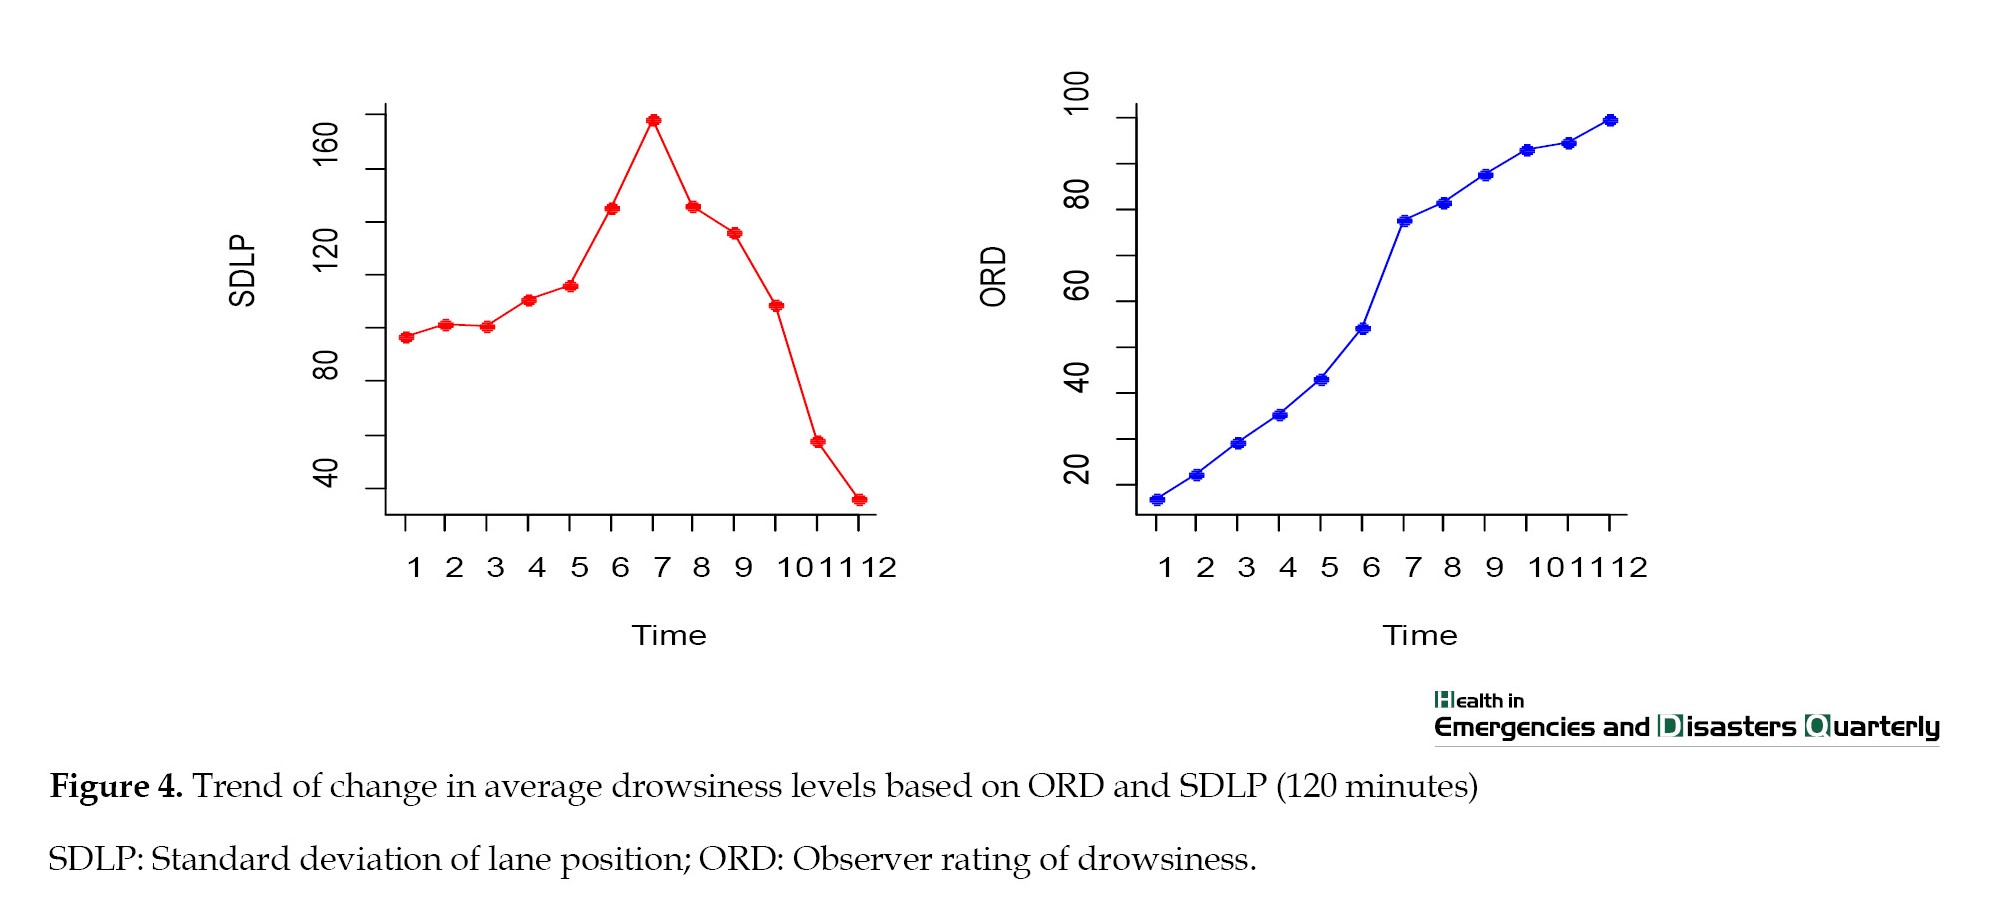
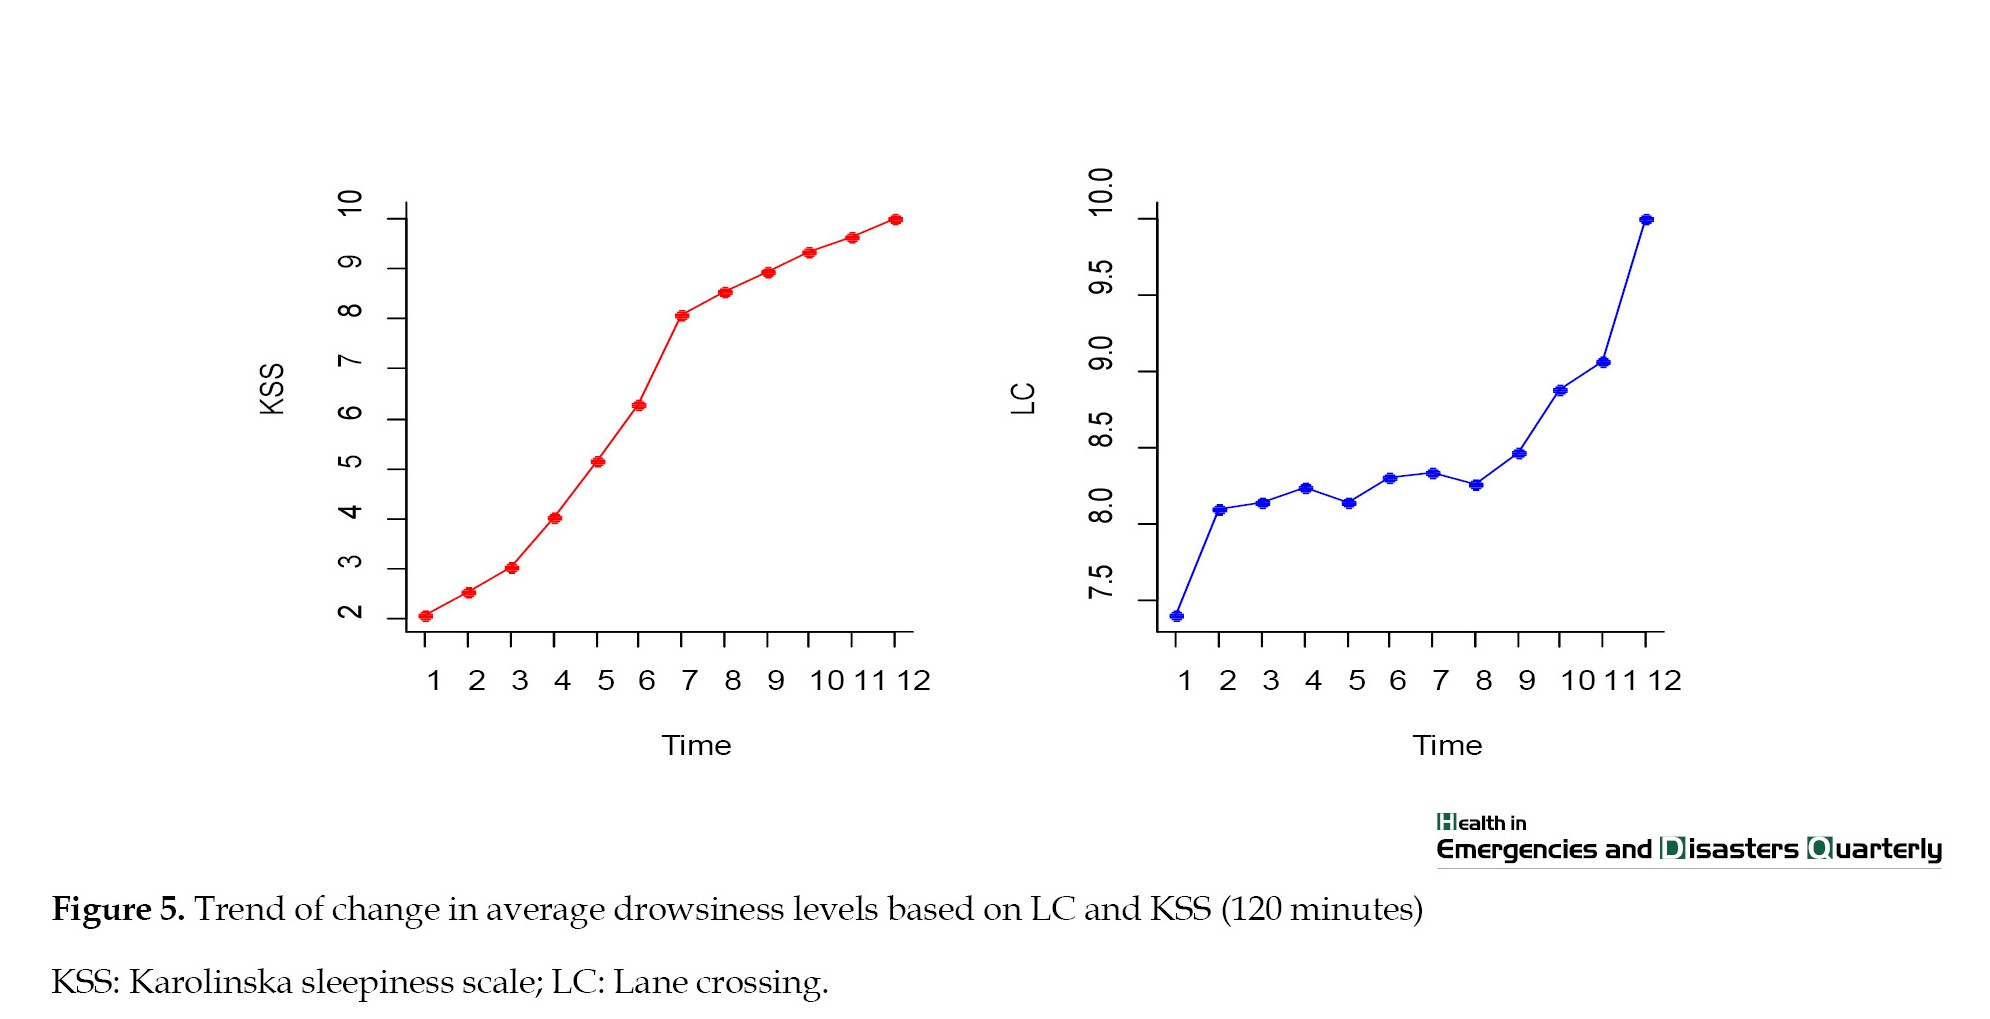
Figure 4 shows that the ORD scale has an upward trend during the 120 min of monitoring, while in SDLP, three different slops are observed. From the beginning of the test to minute 50, there is a slow increase whereas from minute 50 to minute 80 there is a sharp increase. Then, there is a sharp decrease to the end of the test. Garaguzlou and et al. [27] mentioned two reasons for these changes. First, the majority of drivers have not been driving the whole of the time. Second, these changes would be related to the personal performance of every driver. While a linear relationship between the increase in SDLP and with increase in the level of drowsiness has been confirmed [28]. SDLP is a measure of the variability of a vehicle’s lateral position within a lane. It is used as an objective measure of drowsiness and driver performance [22]. Different studies reported significant positive correlations between the ORD levels and all other drowsiness measures, including SDLP [19, 22]. Figure 5 shows that the KSS index has an upward trend with a steep slope until minute 70, but after this time, although the slope has softened, it is still upward. On the other hand, although LC has fluctuation, it has continued its upward trend throughout monitoring duration.
Based on Table 1, in the present study, although a linear combination of SDLP and ORD during 120 min was significant, the Greenhouse-Gayser test showed that ORD over 12 periods of the test had significant changes. This test did not show a significant difference at the level of 5% error of lane deviation during the test. In a study conducted by Kircher et al. [30], it was argued that SDLP is dependent on external contributors such as road marks, weather, and illumination. Another weakness of SDLP is related to microsleep because a device functioning based on lateral position does not detect microsleep. The linear combination of KSS and SDLP is significant. However, Greenhouse-Gayser is only significant for KSS. Our findings are in line with related studies [19, 26, 31, 32]. Based on our investigation of the contributions of drowsiness to driving errors, the correlation between factors of sleepiness, such factors KSS, ORD and LC with neglectable changes yields reasonable results. This can ensure the effectiveness of these variables in determining the level of drowsiness since as time progresses, these variables increase. In addition, by considering the limitations of SDLP it would not be an indicator of drowsiness whereas drowsiness increases the level of SDLP; accordingly, drowsiness leads to lane deviation but lane deviation does not indicate that the driver is drowsy. Therefore, researchers of this study do not account for SDLP as a signal of drowsiness. Thus, an appropriate sign of drowsiness is images of facial features in which as drowsiness is detected, the level of lane deviation is recorded.
Conclusion
Overall, the available results suggest that there is a significant relationship between the level of drowsiness according to KSS and ORD, as well as between the level of drowsiness according to SDLP and ORD. The number of line crossings is a factor used to detect and predict driver drowsiness. In addition, using a combination of sleepiness information and deviation from the lanes, we can detect dangerous levels of drowsiness. It is important to note that drowsiness-related car accidents are a serious problem that can lead to injuries and fatalities, and drivers should take steps to prevent drowsy driving, such as getting enough sleep and taking breaks during long drives.
Study limitations
The study limitation is results of the tests while driving on the road and in a controlled environment will be different. Therefore, the most important limitation of the study was the impossibility of testing in real conditions.
Ethical Considerations
Compliance with ethical guidelines
The current study was registered with the Ethics Committee of Ardabil University of Medical Sciences (Code: IR.ARUMS.REC.1401.151).
Funding
This research did not receive any grant from funding agencies in the public, commercial, or non-profit sectors.
Authors' contributions
All authors equally contributed to preparing this article.
Conflict of interest
The authors declared no conflict of interest.
Acknowledgments
The authors are grateful to all the drivers and colleagues who participated in this research, as well as to the university officials who provided the researchers with the opportunity to conduct this research.
References
Drowsiness, fatigue, distracted driving, and an inability to properly control the vehicle on a safe path are important factors that can significantly contribute to road accidents [1]. In recent years, driver drowsiness has been a common reason for road accidents, leading to physical harm, death, and considerable economic losses [2]. The America National Highway Traffic Safety Administration (NHTSA) estimates that in 2017, a total of 91000 police-reported crashes involved drowsy drivers, resulting in an estimated 50000 injuries and nearly 800 deaths [3]. According to the US National Safety Council (NHTSA), drowsy driving is responsible for approximately 100000 incidents on the roads each year. These accidents result in about 71000 injuries and 1550 deaths [4]. Meanwhile, driver drowsiness is a factor in 10% to 20% of motor vehicle accidents [5]. The German Road Safety Organization (DGUV) states that about 25% of human-caused road accidents are a direct result of driver drowsiness on highways [6]. The negative effects of drowsiness on driving are apparent and it is important to study and understand drivers’ behaviors during drowsiness [7]. The American Academy of Sleep Medicine (AASM) encourages more research to better define indicators of drowsy driving and identify the threshold at which sleepiness while driving becomes dangerous [8]. Continuous and long hours of driving in monotonous circumstances at night and early in the morning are reasons for driver drowsiness and a decrease in driver’s performance [9]. The effects of drowsiness on driving can vary from person to person, and there is no set period for when drowsiness can begin to affect driving. However, according to research by America Centers for Disease Control and Prevention, drowsiness can impair a driver’s ability to pay attention to the road, slow their reaction time, and affect their decision-making abilities [10]. Based on the study by Mabry et al. [11], drowsiness and fatigue can affect a person’s coordination, reaction time, focus, judgment, and memory, which are all necessary for safe driving. Mascord [12] confirms that at different levels of drowsiness, physiological provocation decreases and slow intuitive performances and subsequently defective processing of information will decrease the driver’s responses to stimuli from the environment, unusual circumstances and emergencies. Sleepiness, drowsiness and fatigue are used interchangeably in scientific literature to describe the impaired state caused by the lack of sleep. However, fatigue can have multiple causes, like physical exertion or mental workload. On the other hand, sleepiness and drowsiness refer to the condition induced by sleep loss only [5]. Based on the study by Poursadeghiyan et al. [13], driving between lines and preventing line crossing are principal efforts that are affected by driver’s drowsiness. Therefore, the standard deviation of lane position (SDLP) is a sign of drowsiness [14]. Driving for a long time on monotonous roads can cause fatigue in drivers [13]. As a result, a fatigued driver crosses lines frequently [13, 15]. However, based on a conducted study by Higgins et al. [16], drowsy driving accidents can be prevented by using various methods, such as public awareness campaigns, developing drowsiness detection technologies, implementing hours of service regulations and fatigue risk management for commercial drivers, and introducing laws to prosecute and deter dangerous driving due to fatigue. However, the success of some of these interventions has been variable [5]. Additionally, since scientists do not agree on whether drivers are accurately aware of their drowsiness when driving has significant implications for legal proceedings related to crashes caused by drivers falling asleep behind the wheel [5, 17]. Hence, factors such as the importance of road crashes, the significant role of drowse driving, the varied success of prevention measures, and the high cost of technology in cars used, especially in poor and developing countries, along with the lack of access to higher safety vehicles should be considered. Therefore, the current study is conducted in the Khajeh-Nasir Tosi University Applied Design Laboratory to explore the relationship between subjective and interpretive drowsiness and going off-road in a driving simulator.
Materials and Methods
This experimental study was carried out in Khajeh-Nasir Tosi University Applied Design Laboratory in 2022. A total of 34 men aged 18 to 50 years were randomly selected from the suburbs. They had healthy eyes (no glasses) and normal physical appearance (no long beards or mustaches). The criterion for entering the study included having healthy drivers who are not addicted and do not consume caffeine. In addition, those who did not become severely drowsy during 2 h of continuous driving to the point of deviating from the road were excluded from the study.
Description of the experiments condition
To determine the level of drowsiness and record the driver’s images, a virtual-reality driving simulator was utilized in a fixed temperature and acoustic-controlled and calm room [18]. The participants began driving to detect drowsiness by analyzing facial features. They were noticed to neglect the unrealities of the test and driving the simulator according to traffic regulations. The drivers also drove the simulator tentatively before the test. In this research to provide real conditions of driving a Scania BI 301 simulator (Figure 1) was designed.
The virtual road simulated in the research was a loop with the least side components and the minimum curvatures to induce fatigue. Finally, by matching and synchronizing this data and the data available in libraries and previous studies, the initial model of dynamic facial changes was developed.
Vehicle performance data recording
The device records the data of every frame when it renders the frame; therefore, the rate of sampling is not constant and ranges between 90 Hz to 350 Hz. To suppress these changes, by utilizing linear correlation, the rate of 100 Hz is determined as the rate of sampling. Then, by using the data on the location of the vehicle and information on the side-road lines, the distance between the center of the vehicle and the side-road line is calculated and saved in the output of the device.
Driver selection
In the study, 25 drivers were selected. The criteria were that they should be physically normal with no long beards or moustaches and should have no drug addiction or brain damage. Also, they should not have consumed caffeine-containing drugs foods, or cigarettes for 12 h before the study. In addition, their sleep patterns for a week were assessed using checklists. Both criteria were closely monitored.
Experiment protocol
As the test begins, the driver starts driving on a monotonous road at the speed of 110 km/h for 2 h. A camera takes the driver’s face images by the Karolinska sleepiness scale (KSS) [19] simulated on the road, and appeared once every 10 min. Also, according to the observer rating of drowsiness (ORD) [19], the level of drowsiness was determined by the observer every 10 min. Whole devices, such as the camera and simulator were checked to prevent unexpected ceases in this step of the test. The observer finished the test when the vehicle left the road completely.
Record of ORD, KSS, SDLP and lane crossing (LC) in driving test
In this research, the average ORD, as an objective determination of drowsiness and facial changes is determined according to the review of the video while driving every 10 min, by the observer, KSS criteria as a subjective estimation of sleepiness, displayed 12 times during 120 min on the road monitor screen and the driver must answer it [18]. SDLP approach calculates the deviation of the vehicle’s position from the lane’s center [20]. The LC or lane change criterion reports the number of crossings on the side of the road by the observer in a 10 min period and by observing the road video while driving [21]. Finally, to check the correlation between ORD and KSS during driving by employing the number of line crossings on both sides of the road and changes in the lateral position of the vehicle, repeated measure multivariate analysis of variance was employed. Then, a significant correlation between ORD and KSS, or the number of line crossings and the level of lateral position changes was observed. For every dependent variable variance analysis test with repeated measures and to obtain an appropriate model by considering events in time, the interaction test was conducted for every factor.
Results
Statistical survey on the correlation between ORD and KSS
The results of the multiple variable tests showed that the time variable significantly affects ORD and KSS. Specifically, the combined linear regression of the two dependent variables throughout the 12-period research exhibited a significant difference (F=180.85, P=0.001).
Given that the assumption of independence for the two variables was not maintained after being evaluated using the Mauchly test (P<0.05). Meanwhile, the Greenhouse-Gayser test showed that the variable of KSS exhibited significant changes across the twelve research periods (F=178.3, P=0.001).
The Greenhouse-Gayser test also reported a significant difference at the 5% error level for the ORD variable within the study period. Specifically, the results of the test were F=151.73 and P=0.001 (Figure 2 and Table 1).
Statistical survey on the correlation between ORD and LC
The results of the multiple variable tests showed that the time variable significantly affects ORD and LC. Specifically, the combined linear regression of the two dependent variables throughout the 12-period research exhibited a significant difference (F=170.71, P=0.001).
Given that the assumption of independence for the two variables was not maintained after being evaluated using the Mauchly test (P<0.05), the Greenhouse-Gayser test showed that the variable of LC exhibited significant changes across the twelve research periods (F=4.05, P=0.02).
The Greenhouse-Gayser test also reported a significant difference at the 5% error level for the ORD variable within the study period. Specifically, the results of the test were F=151.73, P=0.001 (Figure 3 and Table 1).
Statistical survey on the correlation between ORD and SDLP
The results of the multiple variable tests showed that the time variable significantly affects ORD and SDLP. Specifically, the combined linear regression of the two dependent variables throughout the 12-period research exhibited a significant difference (F=148.89, P=0.001).
Given that the assumption of independence for the two variables was not maintained after being evaluated using the Mauchly test (P<0.05). The Greenhouse-Gayser test showed that the variable of ORD exhibited significant changes across the twelve research periods (F=140.31, P=0.001).
The Greenhouse-Gayser test also failed to show a significant difference at the 5% error level for the SDLP variable within the study period. Specifically, the results of the test were F=3.17 and P=0.052 (Figure 4 and Table 1).
Statistical survey on the correlation between LC and KSS
The results of multiple variable tests showed that the time variable significantly affects KSS and LC. Specifically, the combined linear regression of the two dependent variables throughout the 12-period research exhibited a significant difference (F=167.19, P=0.001).
Given that the assumption of independence for the two variables was not maintained after being evaluated using the Mauchly test (P<0.05). The Greenhouse-Gayser test showed that the variable of LC exhibited significant changes across the twelve research periods (F=4.05, P=0.001).
The Greenhouse-Gayser test also reported a significant difference at the 5% error level for the ORD variable within the study period. Specifically, the results of the test were F=178.3 and P=0.001 (Figure 5 and Table 1).
Statistical survey on the correlation between SDLP and KSS
The results of multiple variable tests showed that the time variable significantly affects KSS and SDLP. Specifically, the combined linear regression of the two dependent variables throughout the 12-period research exhibited a significant difference (F=643.35, P=0.002).
Given that the assumption of independence for the two variables was not maintained after being evaluated using the Mauchly test (P<0.05). the Greenhouse-Gayser test showed that the variable of KSS exhibited significant changes across the twelve research periods (F=165.21, P=0.002).
The Greenhouse-Gayser test also failed to show a significant difference at the 5% error level for the SDLP variable within the study period. Specifically, the results of the test were F=3.17 and P=0.047 (Figure 6 and Table 1).
Discussion
According to Figure 2, the ORD and KSS indices have an almost similar upward trend during the 120 min of monitoring. The upward trend of these scales occurred at a faster rate between 60 and almost 70 min. The study by Uchiyama et al. [22] found that there are significant positive correlations between the levels of ORD and all other forms of drowsiness, such as subjective self-rating (KSS scores). This indicates an association between objective drowsiness (determined by ORD measurements) and perceived sleepiness (from the KSS scores). The study results by Poursadeghiyan et al. [19] found a significant correlation between the measurement trends of drowsiness levels using KSS and ORD scales, suggesting a connection between both scales. Moreover, the study found that there is a link between the dynamics of mouth movements during the test and drowsiness levels (as measured by KSS and ORD). While this research did not provide specific details on the strength or consistency of the correlation between ORD and KSS, it indicates that there is a significant relationship between the two measures of drowsiness. Figure 3 shows that the mean of changes in drowsiness according to the number of line crossings increases as time progresses and in minutes 50 and 80, two fluctuations were observed but changes had an upward trend. These fluctuations are related to the differences in driving among different drivers [23]. The general upward trend is because of an increase in the level of drowsiness and number of line crossings [24]. The trend of changes in drowsiness shows that in the first thirty minutes of driving, KSS has a gradual upward trend. There is a moderate increase in this trend from minute 30 to minute 80. Then, it slowly increases from minute 80 to minute 120. These different trends can be interpreted as follows. In the first 30 min of driving, drivers confess to the impression of drowsiness on the driving errors, because at the beginning of driving, they do not feel drowsiness or are not drowsy. Then, by minute 80, drivers admit to the drowsiness by answering to KSS questionnaire. Drowsiness exists after minute 80. However, the rate of drowsiness in this period has a slow increase. This may be due to omitting some drivers from the test by lane deviation or line crossing. Nevertheless, this upward trend continues as time progresses [25]. Poursadeghiyan et al. [19], using artificial neural network models, found that the number of line crossings was one of the factors used to detect and predict driver drowsiness. In addition, the study by Jacobé de Naurois et al. [15] found that ORD relies on a persistent scale from “alert” to “extremely drowsy” with a list of criteria that can be observable in the driver, including the number of line crossings. Another study by Akerstedt et al. [23] and Sandberg et al. [26] also confirmed that KSS scores were significantly correlated with the number of line crossings.
Figure 4 shows that the ORD scale has an upward trend during the 120 min of monitoring, while in SDLP, three different slops are observed. From the beginning of the test to minute 50, there is a slow increase whereas from minute 50 to minute 80 there is a sharp increase. Then, there is a sharp decrease to the end of the test. Garaguzlou and et al. [27] mentioned two reasons for these changes. First, the majority of drivers have not been driving the whole of the time. Second, these changes would be related to the personal performance of every driver. While a linear relationship between the increase in SDLP and with increase in the level of drowsiness has been confirmed [28]. SDLP is a measure of the variability of a vehicle’s lateral position within a lane. It is used as an objective measure of drowsiness and driver performance [22]. Different studies reported significant positive correlations between the ORD levels and all other drowsiness measures, including SDLP [19, 22]. Figure 5 shows that the KSS index has an upward trend with a steep slope until minute 70, but after this time, although the slope has softened, it is still upward. On the other hand, although LC has fluctuation, it has continued its upward trend throughout monitoring duration.
Based on Table 1, in the present study, although a linear combination of SDLP and ORD during 120 min was significant, the Greenhouse-Gayser test showed that ORD over 12 periods of the test had significant changes. This test did not show a significant difference at the level of 5% error of lane deviation during the test. In a study conducted by Kircher et al. [30], it was argued that SDLP is dependent on external contributors such as road marks, weather, and illumination. Another weakness of SDLP is related to microsleep because a device functioning based on lateral position does not detect microsleep. The linear combination of KSS and SDLP is significant. However, Greenhouse-Gayser is only significant for KSS. Our findings are in line with related studies [19, 26, 31, 32]. Based on our investigation of the contributions of drowsiness to driving errors, the correlation between factors of sleepiness, such factors KSS, ORD and LC with neglectable changes yields reasonable results. This can ensure the effectiveness of these variables in determining the level of drowsiness since as time progresses, these variables increase. In addition, by considering the limitations of SDLP it would not be an indicator of drowsiness whereas drowsiness increases the level of SDLP; accordingly, drowsiness leads to lane deviation but lane deviation does not indicate that the driver is drowsy. Therefore, researchers of this study do not account for SDLP as a signal of drowsiness. Thus, an appropriate sign of drowsiness is images of facial features in which as drowsiness is detected, the level of lane deviation is recorded.
Conclusion
Overall, the available results suggest that there is a significant relationship between the level of drowsiness according to KSS and ORD, as well as between the level of drowsiness according to SDLP and ORD. The number of line crossings is a factor used to detect and predict driver drowsiness. In addition, using a combination of sleepiness information and deviation from the lanes, we can detect dangerous levels of drowsiness. It is important to note that drowsiness-related car accidents are a serious problem that can lead to injuries and fatalities, and drivers should take steps to prevent drowsy driving, such as getting enough sleep and taking breaks during long drives.
Study limitations
The study limitation is results of the tests while driving on the road and in a controlled environment will be different. Therefore, the most important limitation of the study was the impossibility of testing in real conditions.
Ethical Considerations
Compliance with ethical guidelines
The current study was registered with the Ethics Committee of Ardabil University of Medical Sciences (Code: IR.ARUMS.REC.1401.151).
Funding
This research did not receive any grant from funding agencies in the public, commercial, or non-profit sectors.
Authors' contributions
All authors equally contributed to preparing this article.
Conflict of interest
The authors declared no conflict of interest.
Acknowledgments
The authors are grateful to all the drivers and colleagues who participated in this research, as well as to the university officials who provided the researchers with the opportunity to conduct this research.
References
- Alkinani MH, Zada Khan W Farasan Arshad Q. Arshad, Detecting human driver inattentive and aggressive driving behavior using deep learning: Recent advances, requirements and open challenges. Ieee Access. 2020. 8:105008-30. [DOI:10.1109/ACCESS.2020.2999829]
- Nik Afshar N, Kamali M, Aklaghi Pirposhteh E, Askai Majabadi H, Amanat N, Poursadeqiyan M. [A review of the studies on driver drowsiness detection sensors and proposing hybrid diagnostic methods and efficient model design (Persian)]. Journal of Health and Safety at Work. 2023; 13(1):164-87. [Link]
- Kulhandjian H. Detecting driver drowsiness with multi-sensor data fusion combined with machine learning. San Jose: Mineta Transportation Institute; 2021. [DOI:10.31979/mti.2021.2015]
- Anto A, Chackochan S, Blessen L, Jose J. Iot based real-time driver drowsiness detection and alert system. International Research Journal of Modernization in Engineering Technology and Science. 3(5):1739-45. [Link]
- Cai AWT, Manousakis JE, Lo TYT, Horne JA, Howard ME, Anderson C. I think I'm sleepy, therefore I am-Awareness of sleepiness while driving: A systematic review. Sleep Medicine Reviews. 2021; 60:101533. [DOI:10.1016/j.smrv.2021.101533] [PMID]
- Zobaed T, Rashid S, Mohamed Ahmed A, Saleh A. Real time sleep onset detection from single channel EEG signal using block sample entropy. in IOP Conference Series: Materials Science and Engineering. 2020. 928(3):032021. [DOI:10.1088/1757-899X/928/3/032021]
- Filcek M. Vinci Power nap® synchronization technology-neuroarchitecture for better sleep, adding energy for life, reducing stress and jet lag, improving wellbeing and body-mind regeneration. helpful for leaders, doctors, soldiers, children, drivers, pilots, astronauts, people traveling on earth and beyond. Journal of Biotechnology and Biomedicine. 2023. 6(2):105-28. [DOI:10.26502/jbb.2642-91280076]
- American Academy of Sleep Medicine Board of Directors; Watson NF, Morgenthaler T, Chervin R, Carden K, Kirsch D, Kristo D, et al. Confronting drowsy driving: The American academy of sleep medicine perspective. Journal of Clinical Sleep Medicine. 2015; 11(11):1335-6. [DOI:10.5664/jcsm.5200] [PMID] [PMCID]
- Thiffault P. Managing commercial vehicle driver fatigue in Canada: A government perspective. In: Rudin-Brown CM, Filtness AJ. The handbook of fatigue management in transportation. Boca Raton: CRC Press; 2023. [DOI:10.1201/9781003213154-40]
- National Highway Traffic Safety Administration, part of the U.S. Department of Transportation Drowsy driving: Asleep at the wheel [internet]. 2022. [Updated 2023 JULY]; Available from: [Link]
- Mabry JE, Camden M, Miller A, Sarkar A, Manke A, Ridgeway C, et al. Unravelling the complexity of irregular shiftwork, fatigue and sleep health for commercial drivers and the associated implications for roadway safety. International Journal of Environmental Research and Public Health. 2022; 19(22):14780. [DOI:10.3390/ijerph192214780] [PMID] [PMCID]
- Mascord DJ, Heath RA. Behavioral and physiological indices of fatigue in a visual tracking task. Journal of Safety Research. 1992; 23(1):19-25. [DOI:10.1016/0022-4375(92)90036-9]
- Poursadeghiyan M, Mazloumi A, Nasl Saraji G, Baneshi MM, Khammar A, Ebrahimi MH. Using image processing in the proposed drowsiness detection system design. Iranian Journal of Public Health. 2018; 47(9):1371-8. [PMID] [PMCID]
- Das A, Ghasemzadeh A, Ahmed MM. Analyzing the effect of fog weather conditions on driver lane-keeping performance using the SHRP2 naturalistic driving study data. Journal of Safety Research. 2019; 68:71-80. [DOI:10.1016/j.jsr.2018.12.015] [PMID]
- Jacobé de Naurois C, Bourdin C, Stratulat A, Diaz E, Vercher JL. Detection and prediction of driver drowsiness using artificial neural network models. Accident; Analysis and Prevention. 2019; 126:95-104. [DOI:10.1016/j.aap.2017.11.038] [PMID]
- Higgins JS, Michael J, Austin R, Åkerstedt T, Van Dongen HP, Watson N, et al. Asleep at the wheel-the road to addressing drowsy driving. Sleep. 2017; 40(2):zsx001. [DOI:10.1093/sleep/zsx001] [PMID]
- Magán E, Sesmero MP, Alonso-Weber JM, Sanchis A. Driver drowsiness detection by applying deep learning techniques to sequences of images. Applied Sciences. 2022; 12(3):1145. [DOI:10.3390/app12031145]
- Karchani M, Mazloumi A, NaslSaraji G, Akbarzadeh A, Niknezhad A, Ebrahimi MH, et al. Association of subjective and interpretive drowsiness with facial dynamic changes in simulator driving. Journal of Research in Health Sciences. 2015; 15(4):250-5. [PMID]
- Poursadeghiyan M, Mazloumi A, Nasl Saraji G, Niknezhad, Akbarzadeh A, Ebrahimi MH. Determination the levels of subjective and observer rating of drowsiness and their associations with facial dynamic changes. Iranian Journal of Public Health. 2017; 46(1):93. [Link]
- Caryn FH, Rahadianti L. Driver drowsiness detection based on drivers’ physical behaviours: A systematic literature review. Computer Engineering & Applications Journal. 2021; 10(3):161-75. [DOI:10.18495/comengapp.v10i3.381]
- Chae H, Jeong Y, Lee H, Park J, Yi K. Design and implementation of human driving data-based active lane change control for autonomous vehicles. Proceedings of the Institution of Mechanical Engineers, Part D: Journal of Automobile Engineering. 2021; 235(1):55-77. [DOI:10.1177/0954407020947678]
- Uchiyama Y, Sawai S, Omi T, Yamauchi K, Tamura K, Sakata T, et al. Convergent validity of video-based observer rating of drowsiness, against subjective, behavioral, and physiological measures. Plos One. 2023; 18(5):e0285557. [DOI:10.1371/journal.pone.0285557] [PMID] [PMCID]
- Akerstedt T, Anund A, Axelsson J, Kecklund G. Subjective sleepiness is a sensitive indicator of insufficient sleep and impaired waking function. Journal of Sleep Research. 2014; 23(3):240-52. [DOI:10.1111/jsr.12158] [PMID]
- Whittall H, Pillion M, Gradisar M. Daytime sleepiness, driving performance, reaction time and inhibitory control during sleep restriction therapy for Chronic Insomnia Disorder. Sleep Medicine. 2018; 45:44-8. [DOI:10.1016/j.sleep.2017.10.007] [PMID]
- Sparrow AR, Mollicone DJ, Kan K, Bartels R, Satterfield BC, Riedy SM, et al. Naturalistic field study of the restart break in US commercial motor vehicle drivers: Truck driving, sleep, and fatigue. Accident; Analysis and Prevention. 2016; 93:55-64. [DOI:10.1016/j.aap.2016.04.019] [PMID]
- Sandberg D, Anund A, Fors C, Kecklund G, Karlsson JG, Wahde M, et al. The characteristics of sleepiness during real driving at night--a study of driving performance, physiology and subjective experience. Sleep. 2011; 34(10):1317-25. [DOI:10.5665/SLEEP.1270] [PMID] [PMCID]
- Gharagozlou F, Nasl Saraji G, Mazloumi A, Nahvi A, Motie Nasrabadi A, et al. Detecting driver mental fatigue based on EEG alpha power changes during simulated driving. Iranian Journal of Public Health. 2015; 44(12):1693-700. [PMID] [PMCID]
- Horne J. Sleepfaring: A journey through the science of sleep. Oxford: Oxford University Press; 2006. [DOI:10.1093/oso/9780192807311.001.0001]
- Verster JC, Roth T. Standard operation procedures for conducting the on-the-road driving test, and measurement of the standard deviation of lateral position (SDLP). International Journal of General Medicine. 2011; 4:359-71. [DOI:10.2147/IJGM.S19639] [PMID] [PMCID]
- Kircher A, Uddman M, Sandin J. Vehicle control and drowsiness. Linkoping: Swedish National Road and Transport Research Institute; 2002. [Link]
- Anund A, Fors C, Ahlstrom C. The severity of driver fatigue in terms of line crossing: A pilot study comparing day-and night time driving in simulator. European Transport Research Review. 2017; 9(2):1-7. [DOI:10.1007/s12544-017-0248-6]
- Stancin I, Cifrek M, Jovic A. A review of EEG signal features and their application in driver drowsiness detection systems. Sensors. 2021; 21(11):3786. [DOI:10.3390/s21113786] [PMID] [PMCID]
Type of Study: Review |
Subject:
Emergency
Received: 2023/04/29 | Accepted: 2024/01/28 | Published: 2024/07/1
Received: 2023/04/29 | Accepted: 2024/01/28 | Published: 2024/07/1
Send email to the article author
| Rights and permissions | |
 |
This work is licensed under a Creative Commons Attribution-NonCommercial 4.0 International License. |
Copyright © The Author(s);
This is an open access article distributed under the terms of the Creative Commons Attribution License (CC-By-NC), which permits use, distribution, and reproduction in any medium, provided the original work is properly cited and is not used for commercial purposes.
Contact Information
This is an open access article distributed under the terms of the Creative Commons Attribution License (CC-By-NC), which permits use, distribution, and reproduction in any medium, provided the original work is properly cited and is not used for commercial purposes.
Contact Information
