

Volume 10, Issue 4 (Summer 2025)
Health in Emergencies and Disasters Quarterly 2025, 10(4): 247-258 |
Back to browse issues page


Download citation:
BibTeX | RIS | EndNote | Medlars | ProCite | Reference Manager | RefWorks
Send citation to:


BibTeX | RIS | EndNote | Medlars | ProCite | Reference Manager | RefWorks
Send citation to:
Babanezhad M, Khorsha H, Mohajervatan A, Choori A. Estimating the Demand for Ambulances in Traffic Accidents. Health in Emergencies and Disasters Quarterly 2025; 10 (4) :247-258
URL: http://hdq.uswr.ac.ir/article-1-641-en.html
URL: http://hdq.uswr.ac.ir/article-1-641-en.html


1- Department of Statistics, Faculty of Sciences, Golestan University, Gorgan, Iran.
2- Department of Management of Statistics and Information Technology, Golestan University of Medical Sciences, Gorgan, Iran.
3- Department of Anesthesia and Prehospital Emergency Care, School of Paramedical Sciences, Golestan University of Medical Sciences, Gorgan, Iran. ,Mohajervatanali@yahoo.com
4- Department of Humanities and Sport Science, Faculty of Sport Sciences, University of Gonbad Kavous, Gonbad, Iran.
2- Department of Management of Statistics and Information Technology, Golestan University of Medical Sciences, Gorgan, Iran.
3- Department of Anesthesia and Prehospital Emergency Care, School of Paramedical Sciences, Golestan University of Medical Sciences, Gorgan, Iran. ,
4- Department of Humanities and Sport Science, Faculty of Sport Sciences, University of Gonbad Kavous, Gonbad, Iran.
Full-Text [PDF 1147 kb]
(1049 Downloads)
| Abstract (HTML) (3939 Views)
Full-Text: (1013 Views)
Introduction
Emergency medical services (EMS) worldwide face significant challenges, mainly due to the impact of road traffic accidents [1]. These incidents include a considerable part of calls to emergency dispatch centers [2]. Providing effective EMS in these incidents requires careful resource planning, which generally relies on forecasting operational, tactical, and strategic demand. Care providers outside the hospital typically face economic and human resource limitations [3]. The primary goal of EMS in these events is to minimize emergency response time while managing operational costs [4]. Failing to match available resources with demand in EMS seriously affects patients, staff, and the entire healthcare system [5, 6]. The imbalanced demand for ambulances in terms of space and time has made EMS physicians dependent on predicting the volume of care to develop staffing and dynamic deployment plans [7]. Robust forecasting will allow sound decisions for capacity and staffing levels. Accurate forecasting of the demand and optimal management of the ambulance fleet can increase the chance of the injured’s survival and the system’s efficiency. An efficient medical emergency system has led to numerous studies in this field [8, 9]. Estimating the association between resources and demand in EMS is crucial to ensure timely and effective response to emergencies, such as road traffic accidents [10, 11]. In contrast to the typical methods employed by research centers that often rely on descriptive techniques and focus on presenting reports with graphs, it is crucial to establish a suitable model for predicting and assessing outcomes [12].
Nevertheless, certain potential biases may result in inaccurate predictions and inadequate resource distribution. As a result of using a faulty model, there is a risk of inaccurately estimating demand due to the failure to appropriately represent the connections between demand and resources. This may lead to improper distribution of resources and unsatisfactory results [13-18]. Various forecasting methods are used in the health system, including historical averaging, smoothing techniques, linear regression and autoregressive integrated moving average (ARIMA) modeling [19-24]. Generally, two main streams of research are related to forecasting ambulance demand in EMS. The first stream focuses on applying time series methods and regression approaches to forecasting aggregate ambulance demand [25, 26]. The second stream enables the forecasting of EMS demand using spatiotemporal forecasting methods [4]. There are many studies on applying time series forecasting (TSF) in EMS [27, 28]. The TSF predicts system behavior by utilizing both current and past data. TSF addresses real-world issues, including traffic systems, oil market dynamics, weather predictions and financial markets [29]. The examination and prediction of time series typically rely on ARIMA models and their different variations [30]. However, research highlights that utilizing suitable time series models is the best option for prediction [31]. The time series methods give users better results than other statistical methods for seasonal forecasts in EMS [5]. This outcome may be because time series models monitor key performance indicators that can be a powerful tool for organizations to gain insights and make data-driven decisions. By analyzing historical data and using time series models to predict future trends and patterns, organizations can identify potential issues before they become major problems [10]. Hence in this study, we intend to use a time series model to estimate demand ambulance in traffic accidents in the emergency medical system to help managers to optimize resource allocation and response times.
Materials and Methods
Sample and study design
A retrospective cohort study was conducted on ambulance demands for traffic accidents in the Golestan Province of Iran from March 2021 to March 2023. In this research, we conducted a longitudinal analysis of calls that resulted in ambulance dispatch during traffic accidents. These studies aid in creating and executing more efficient preventive strategies to enhance ambulance demand management. All individuals involved in traffic accidents who were taken to a hospital by EMS were part of the study’s statistical population. All the ambulances sent out for traffic injuries were chosen using the census method. The information was derived from the prehospital care report. These data included the request time and the EMS’s reaction times (RT). We used performance indicators in the form of time series data to effectively monitor prehospital emergency services. Two measurements, RT and total prehospital time (TPT), were utilized in a temporal sequence. We used statistical methods to present the performance indicators individually.
Forecasting approach
The individual forecasting time series model is a standard and straightforward method. We assume the coming days will be the same as the previous ones. In other words, we use the empirical distribution of past daily accidents to create a predictive distribution of future accidents. At first, the data were smoothed by removing flows and seasonal changes. To remove the tides or long-term changes in the average, we used the one-step differential method and to remove the seasonal changes, we used the Box-Cox transformation to create stability in the variance. Then, we fitted a suitable time series model to the smoothed data. With data availability or smoothed past events, we use it as a key to make reliable predictions. The final data results forecast the expected demand for ambulances for traffic accidents in the upcoming years. We used R statistical software, version 4.5.0 and the forecast package.
Results
Descriptive statistical analysis
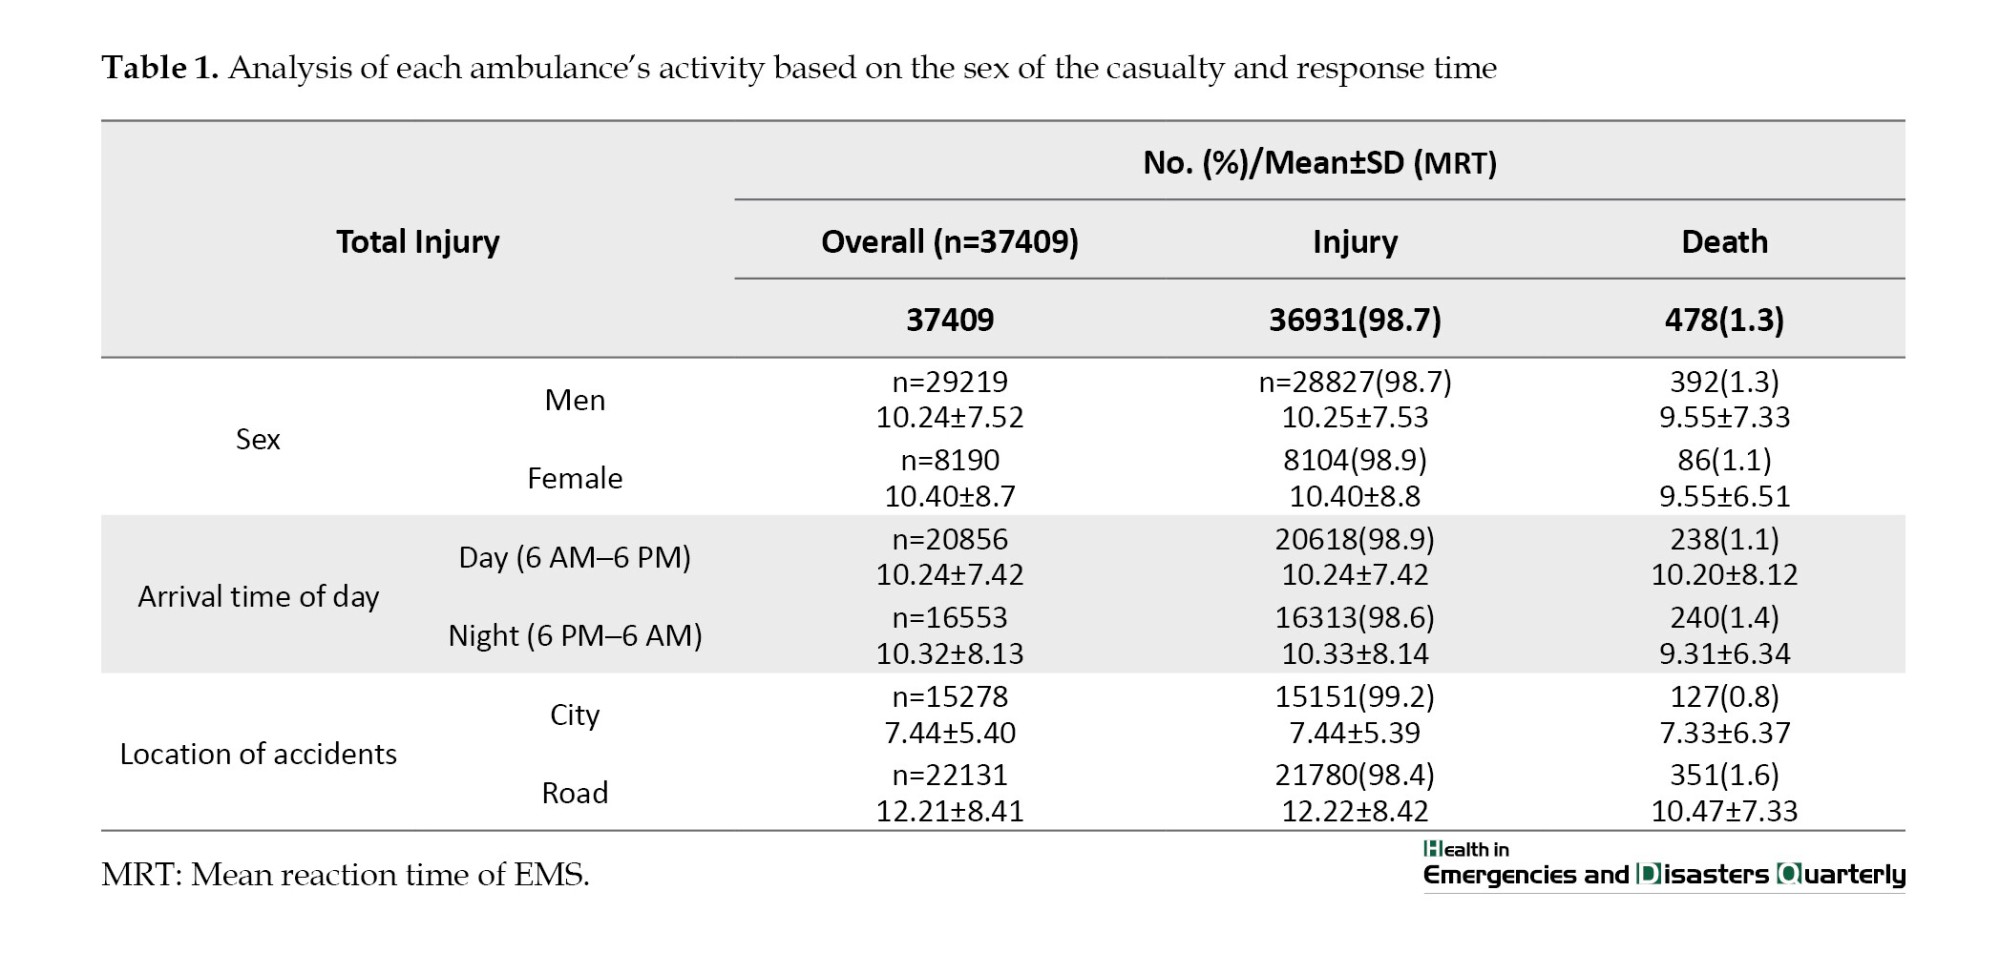
Throughout the study period, 37409 requests were recorded for traffic accidents. Since it is sensitive data, it does not include personal or postcode information. Our findings indicate that, according to the chi-square test, there is a significantly higher number of injuries and deaths in men compared to women (P<0.05). It is noted that accidents occur more frequently during the day than at night. Nonetheless, fatal accidents are more common at night compared to daytime (P˂0.05). After analyzing accident locations, it was discovered that urban transportation accidents result in more injuries than road accidents, yet road accidents have a higher fatality rate (P˂0.05). The t-test analysis indicates a significant difference in EMS arrival time at accident scenes based on location (city or roads) (Table 1).
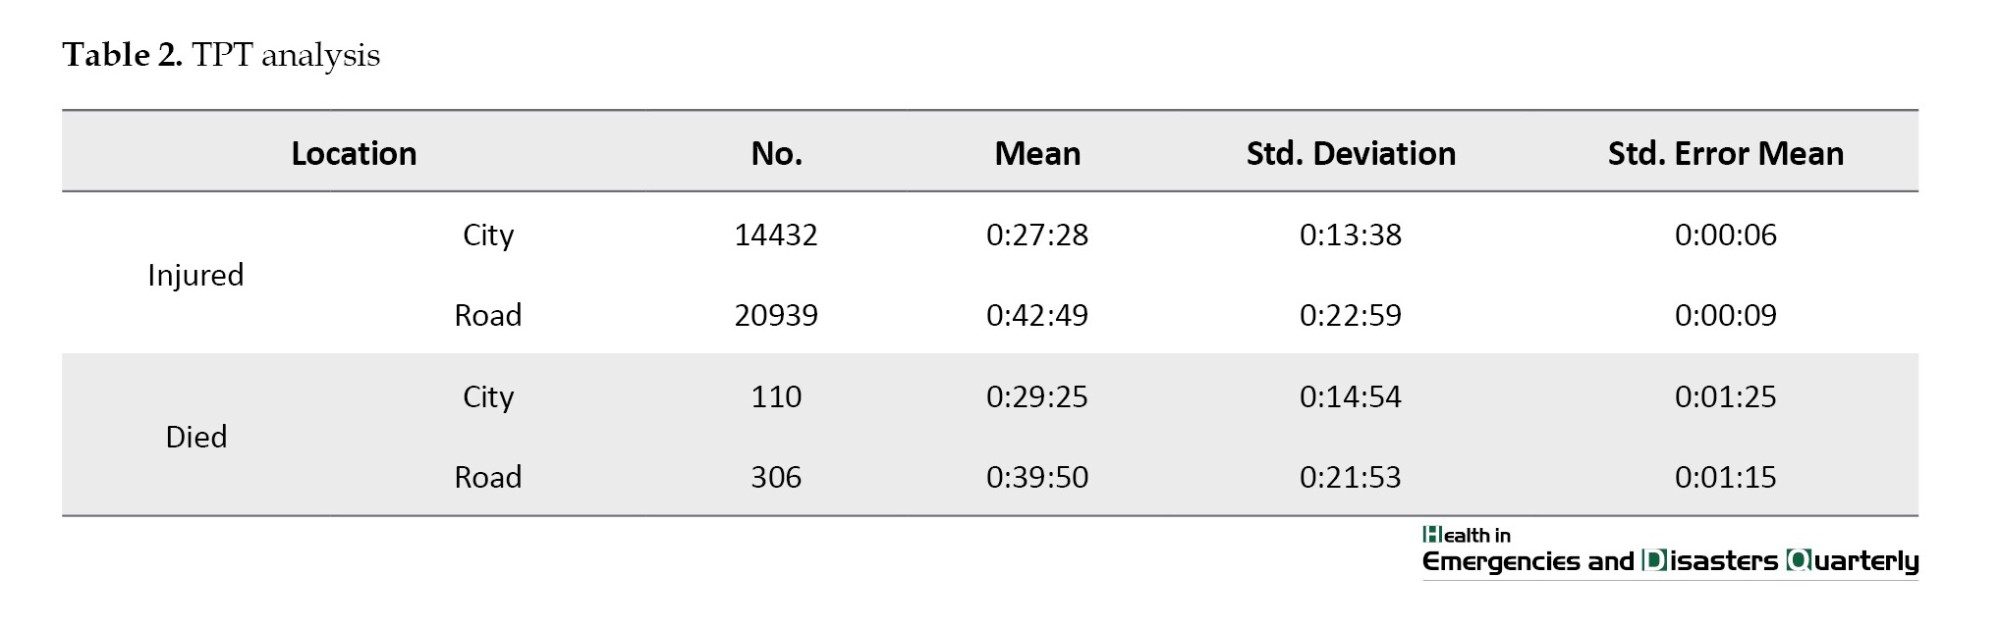
The data indicates that the TPT within the city differs from the TPT on the road. The noted distinction is statistically meaningful and can be deemed genuine (P˂0.05). This result suggests that traffic congestion, road conditions, and infrastructure affect TPT in urban and rural areas. The research findings could help guide choices regarding transportation planning, urban design, and traffic management approaches to enhance TPT both in the city and on the highway (Table 2).
Time series analysis
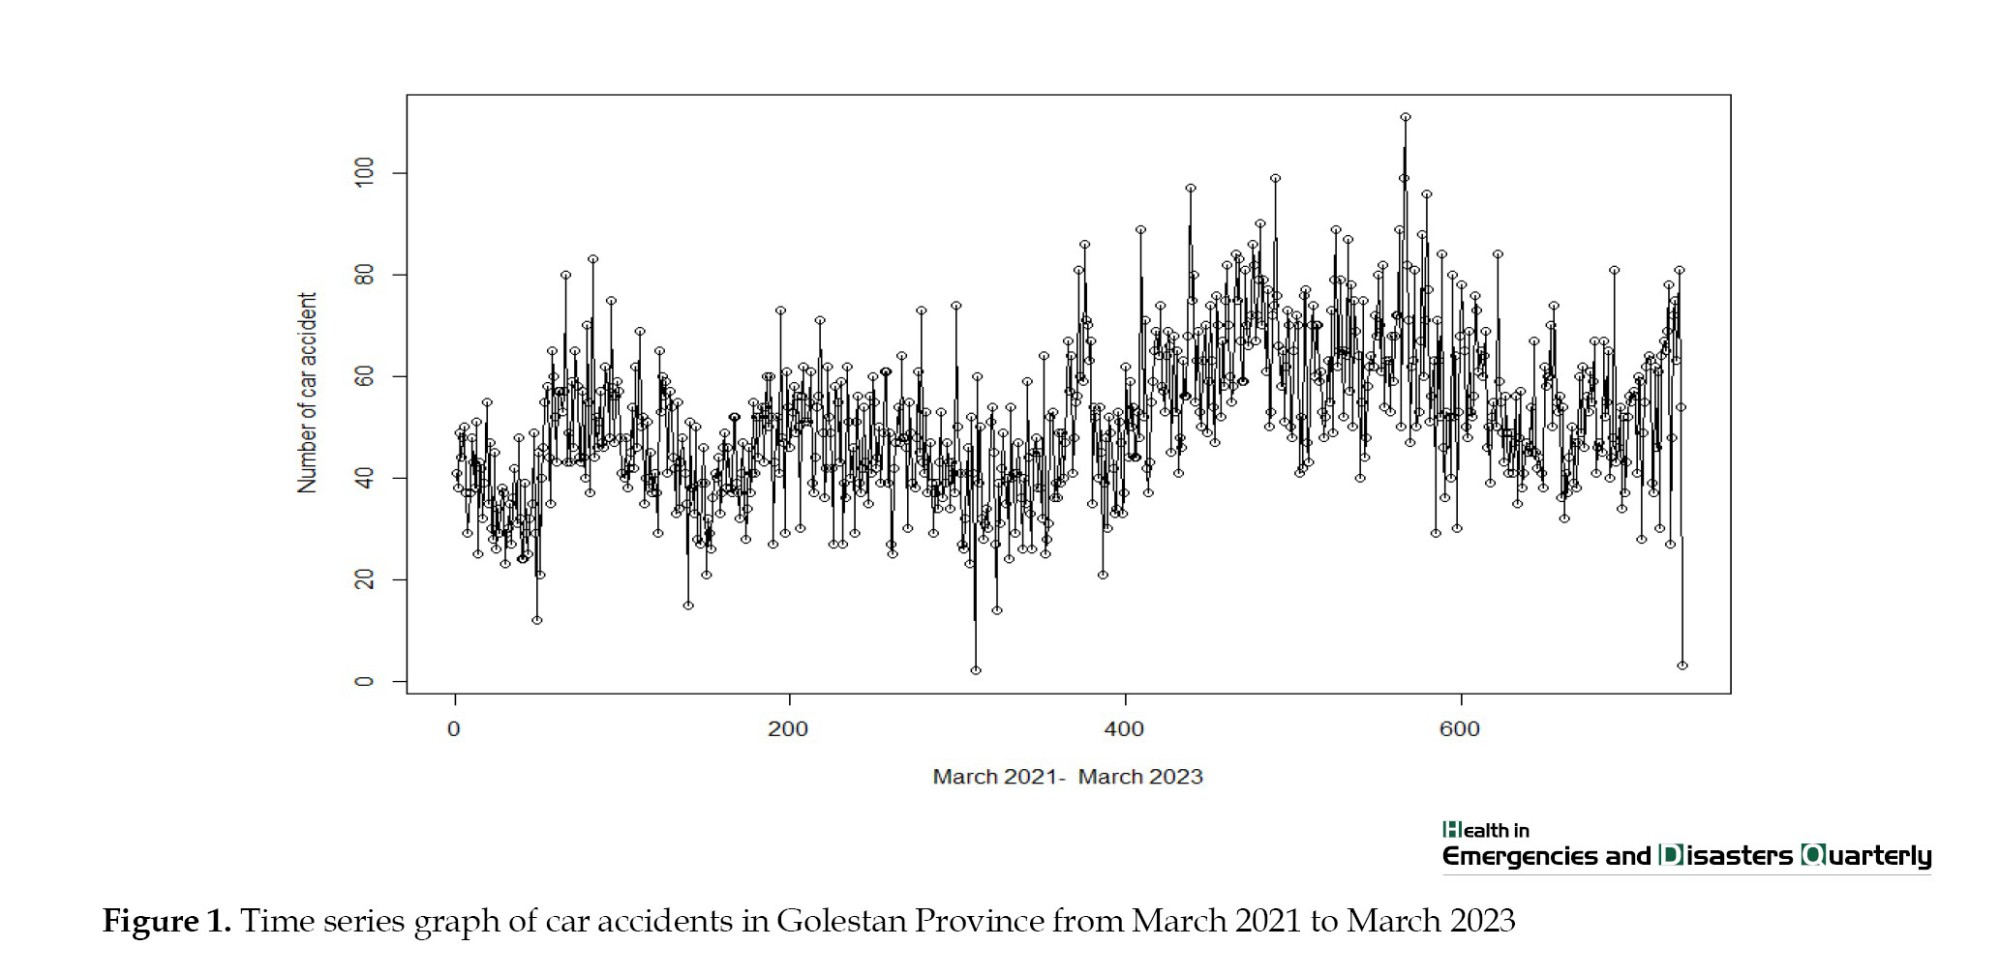
In step 1, the study was conducted at a daily time-series level. Each observation represents the daily count of emergency calls that resulted in the dispatch of one or more emergency ambulances. By plotting the time series graph in Figure 1, we found flow or long-term changes in the average. The time series average has a trend or exhibits long-term changes over time. This outcome could indicate underlying factors, such as seasonality, growth, or resource decline. There were also more random fluctuations in the data during the summer months compared to other months. This result could be due to various reasons, such as changes in demand, availability of resources, or external factors. Further, more accidents occurred in the summer of 2023 than in the summer of 2021.
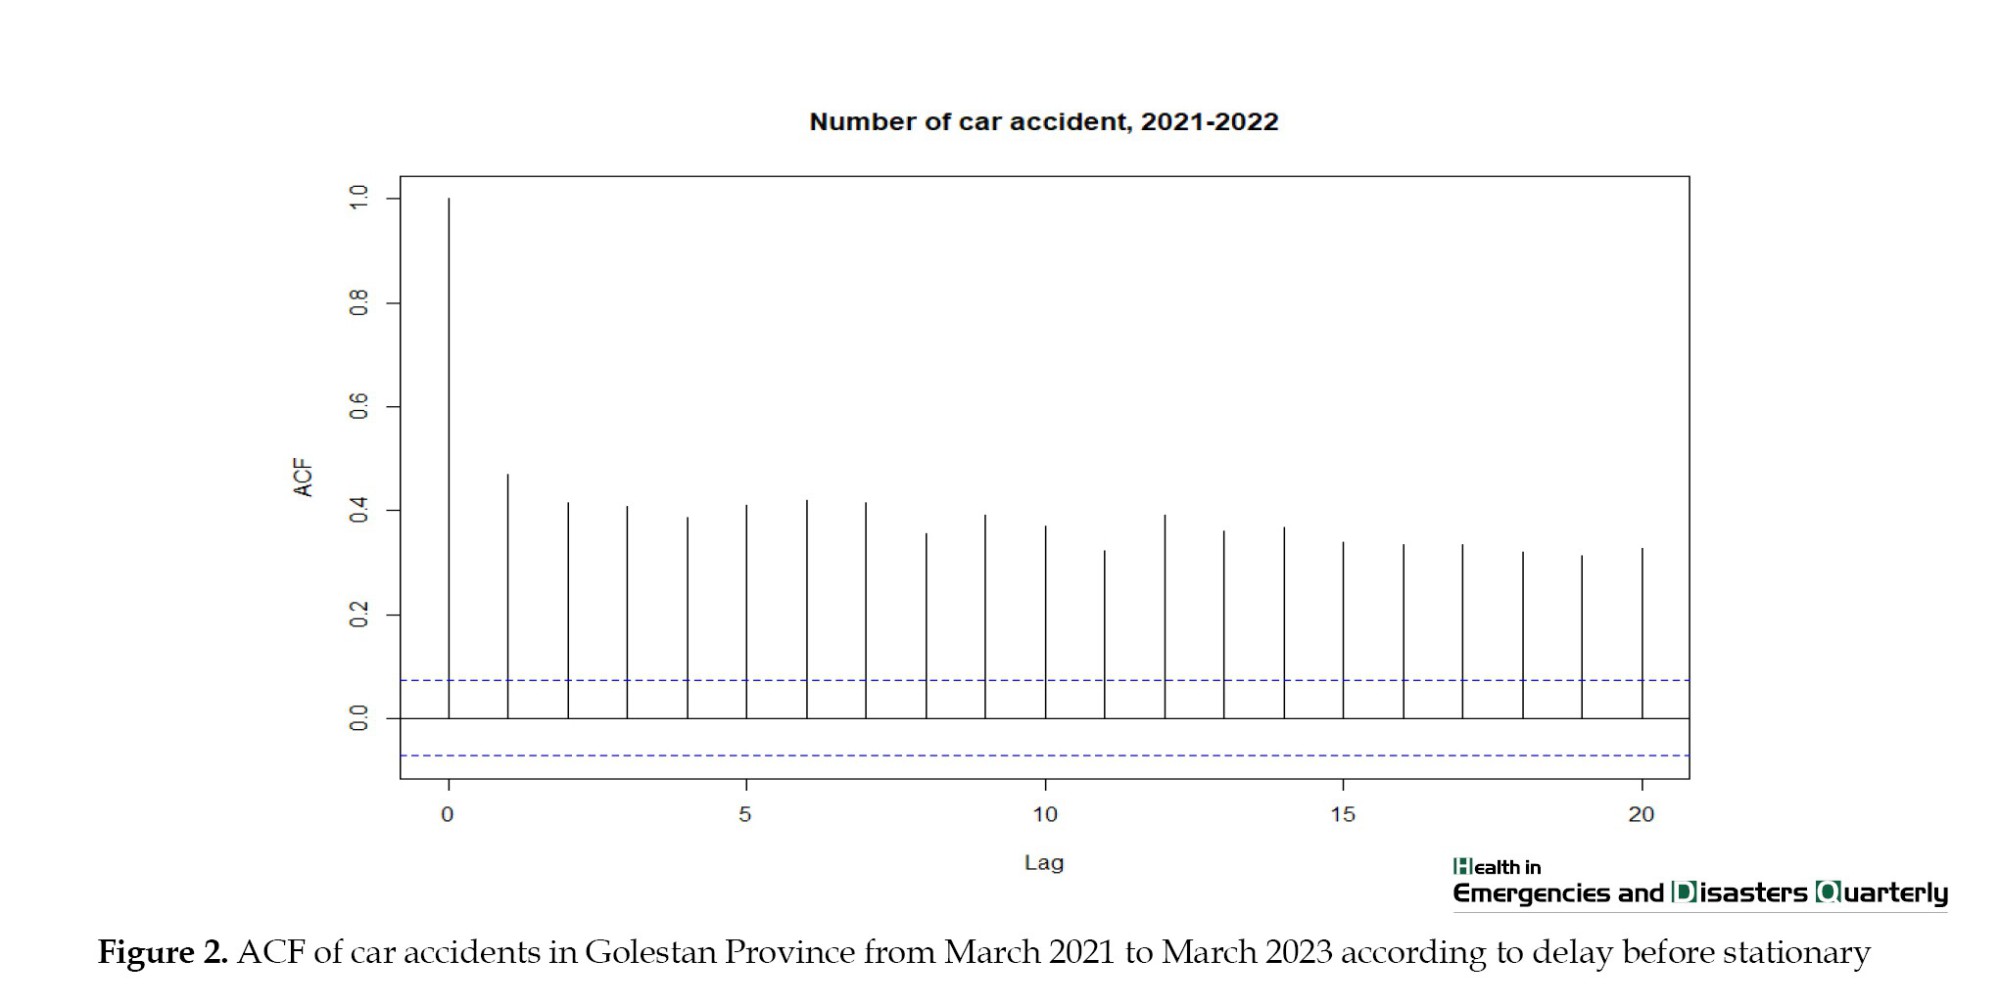
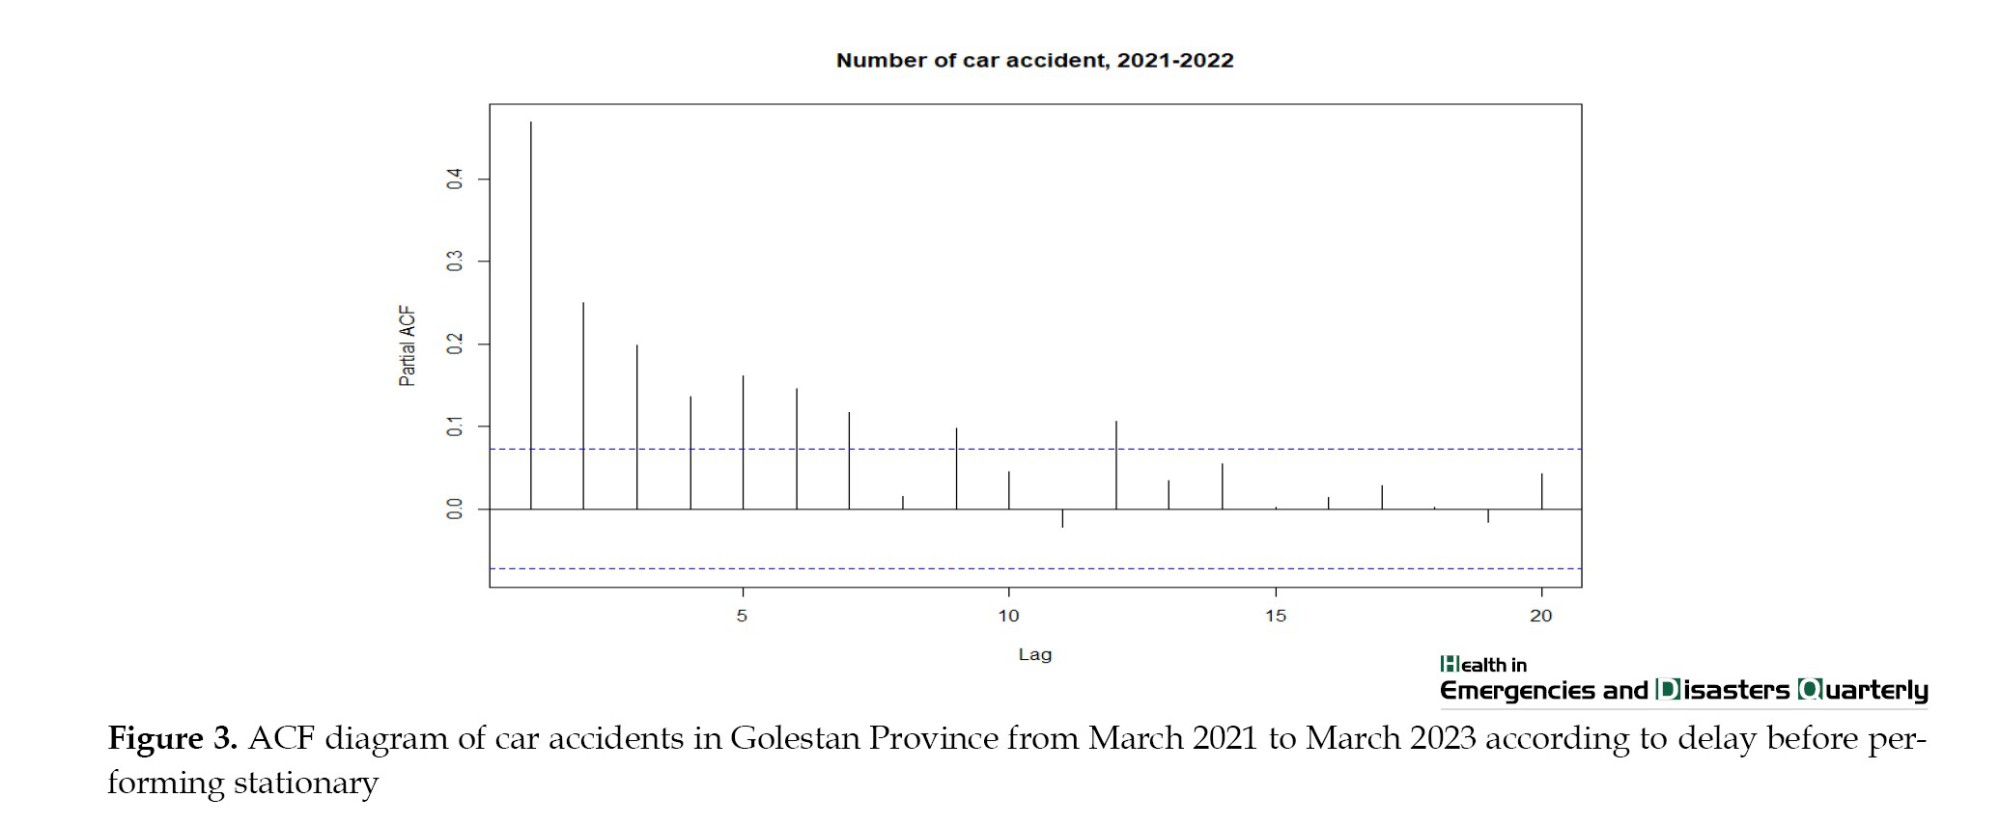
This means that the data shows seasonal changes. We first made the data stationary to determine which time series model the accident data follows. Then, we plotted the autocorrelation and partial autocorrelation coefficients (ACF) of these data regarding delay. Autocorrelation measures the correlation between a time series and its past values, while partial autocorrelation measures the correlation between a time series and its past values after controlling for intermediate values. We used the data differentiation method to fix data stationarity. We transformed the non-stationarity of a time series into a stationary series by differentiating and stabilizing its variance by box-cox transformation (Figures 1, 2 and 3).
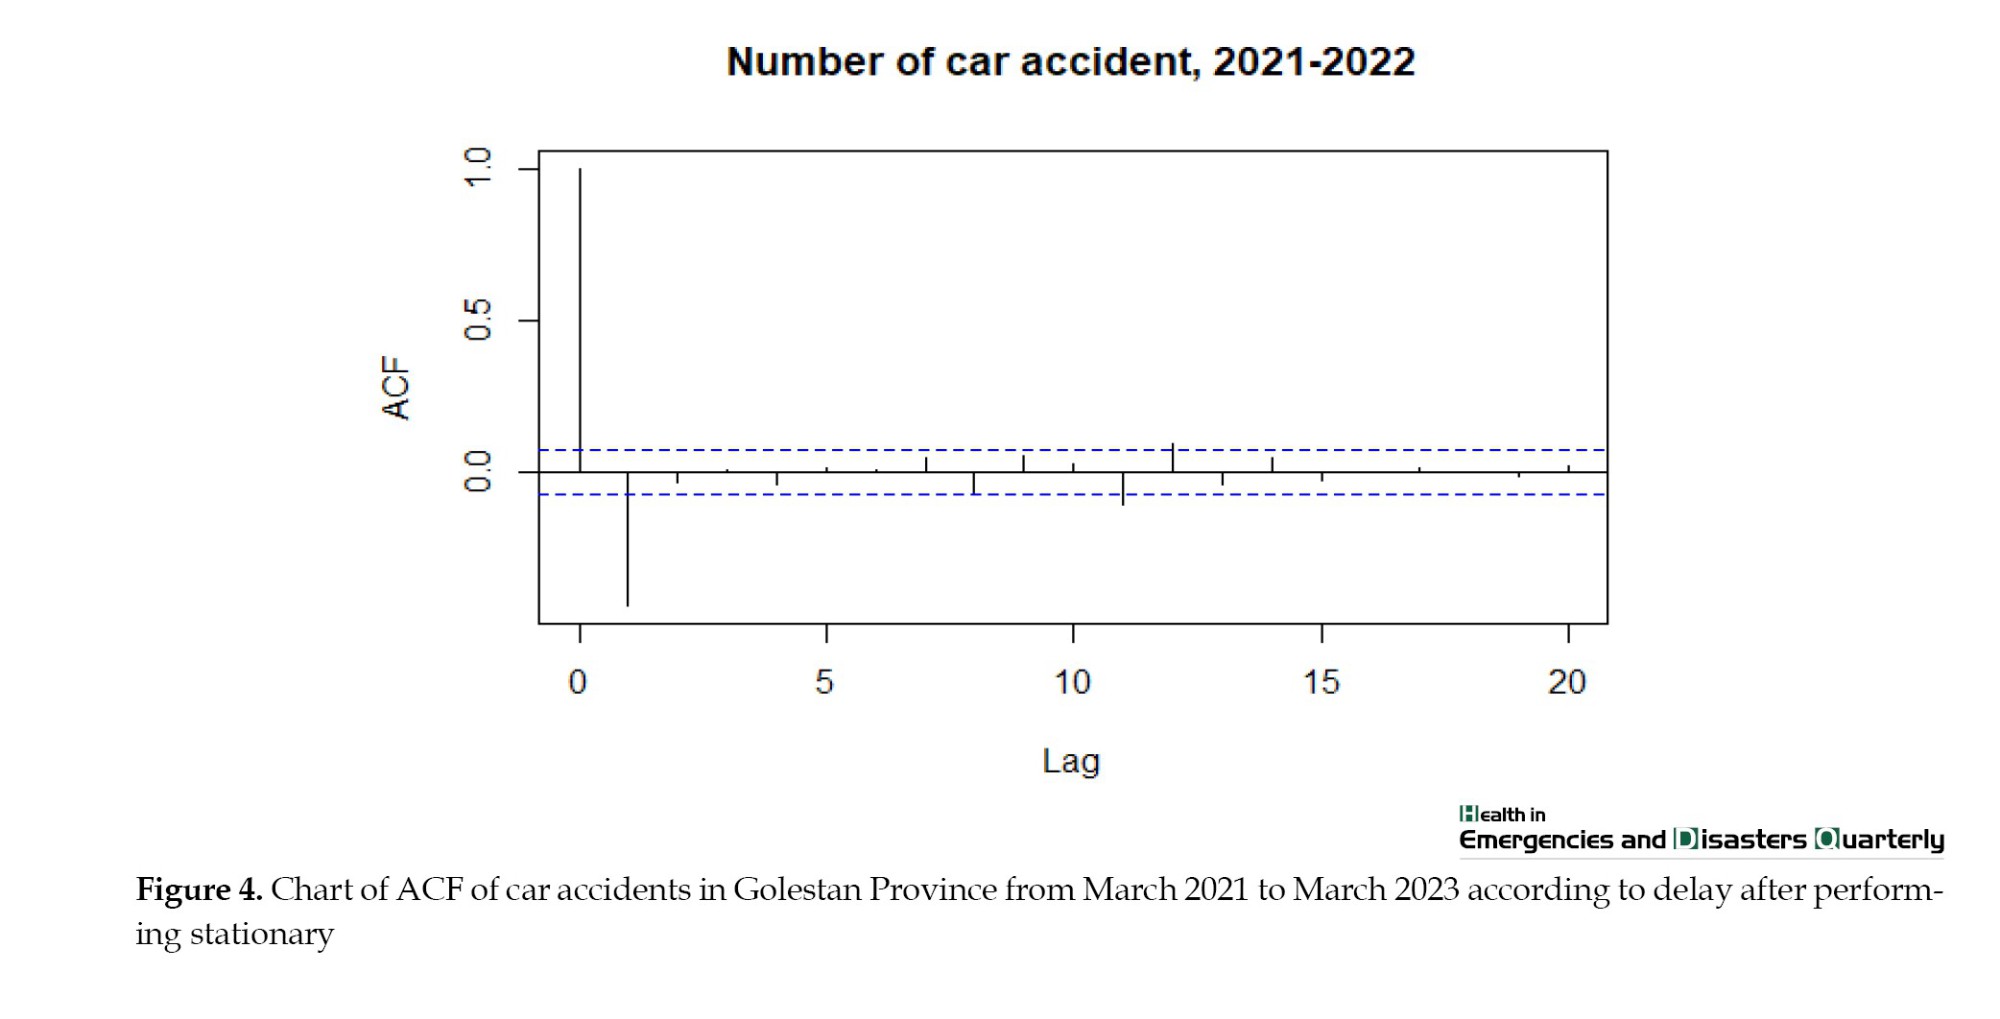
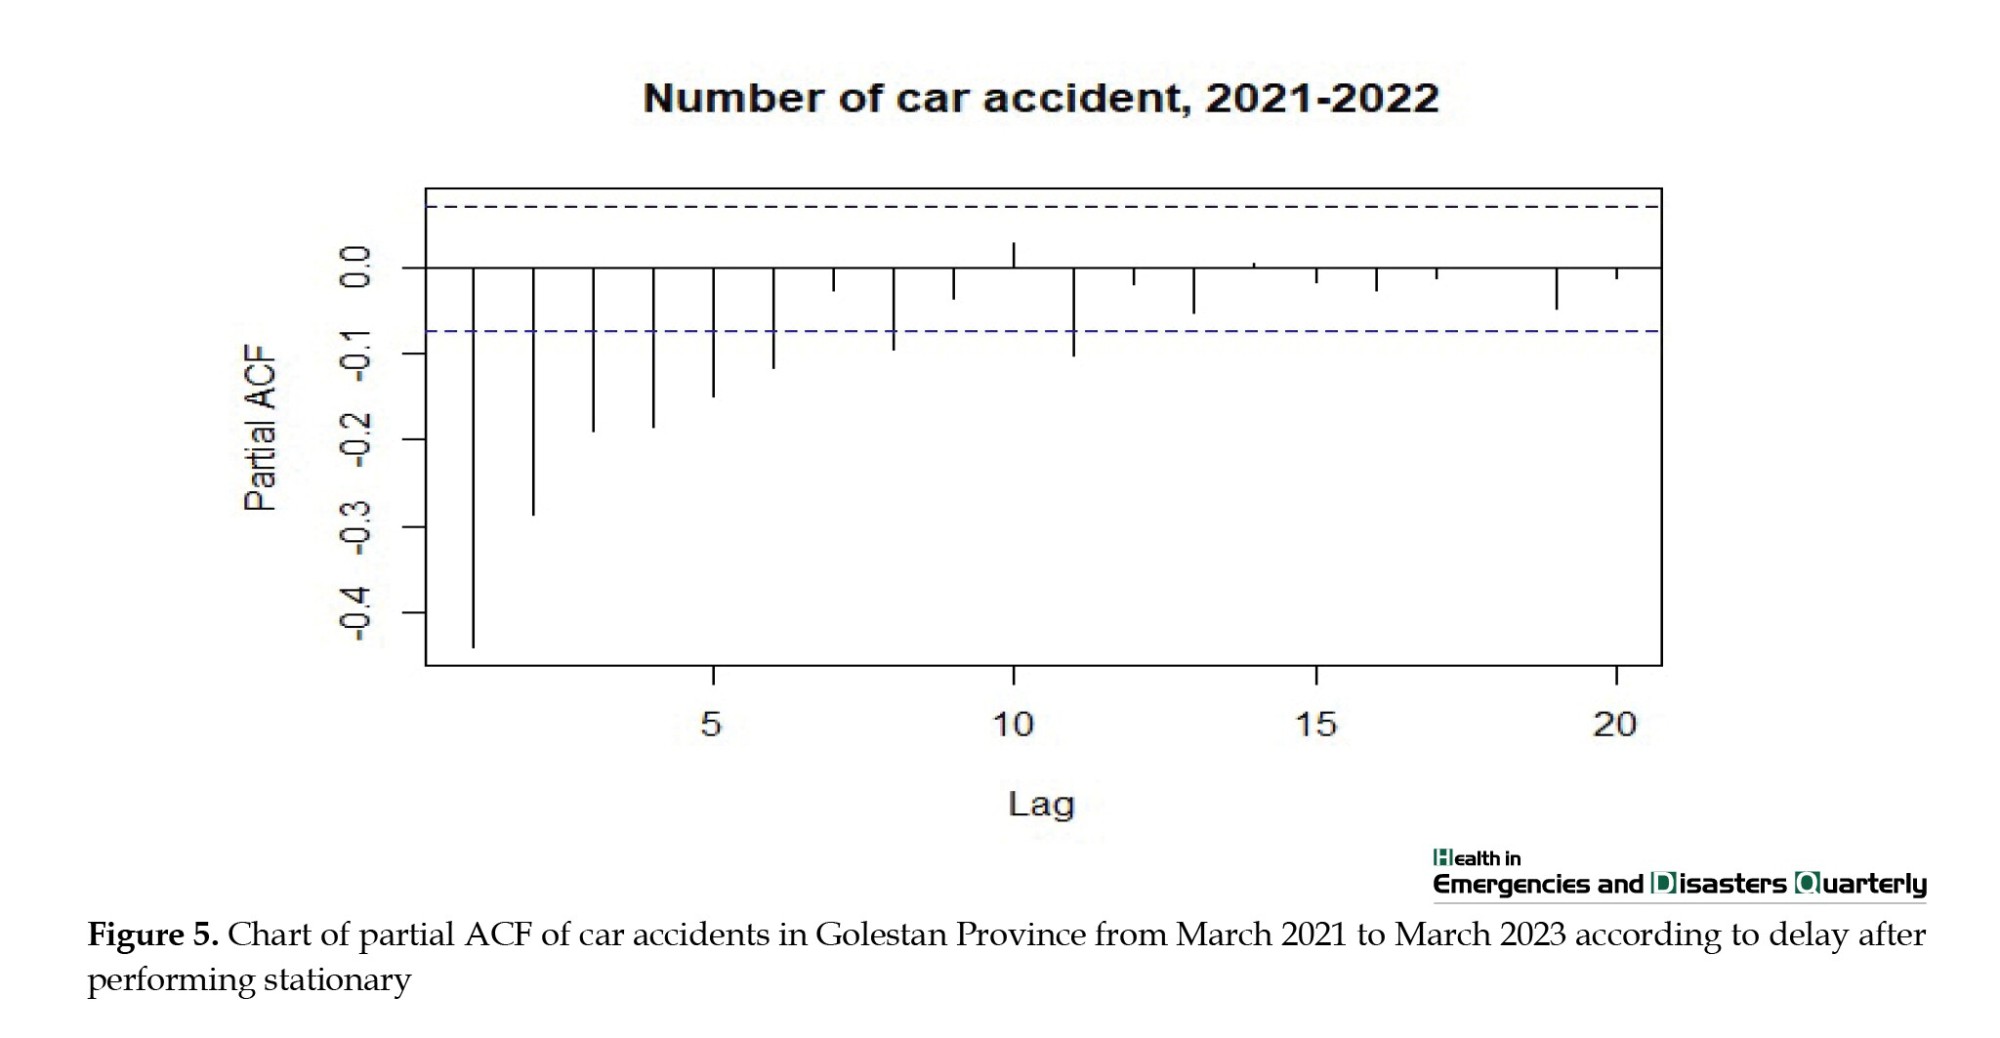
In step 2, we differentiated the data once and performed the augmented dickey-fuller test. The associated P is below the threshold, leading to the rejection of the null hypothesis. Consequently, evidence suggests that the one-step differentiated data is stationary. We then drew graphs of autocorrelation and partial ACF (Figures 4 and 5). We found that the data follows the ARIMA model (1, 1, 5).
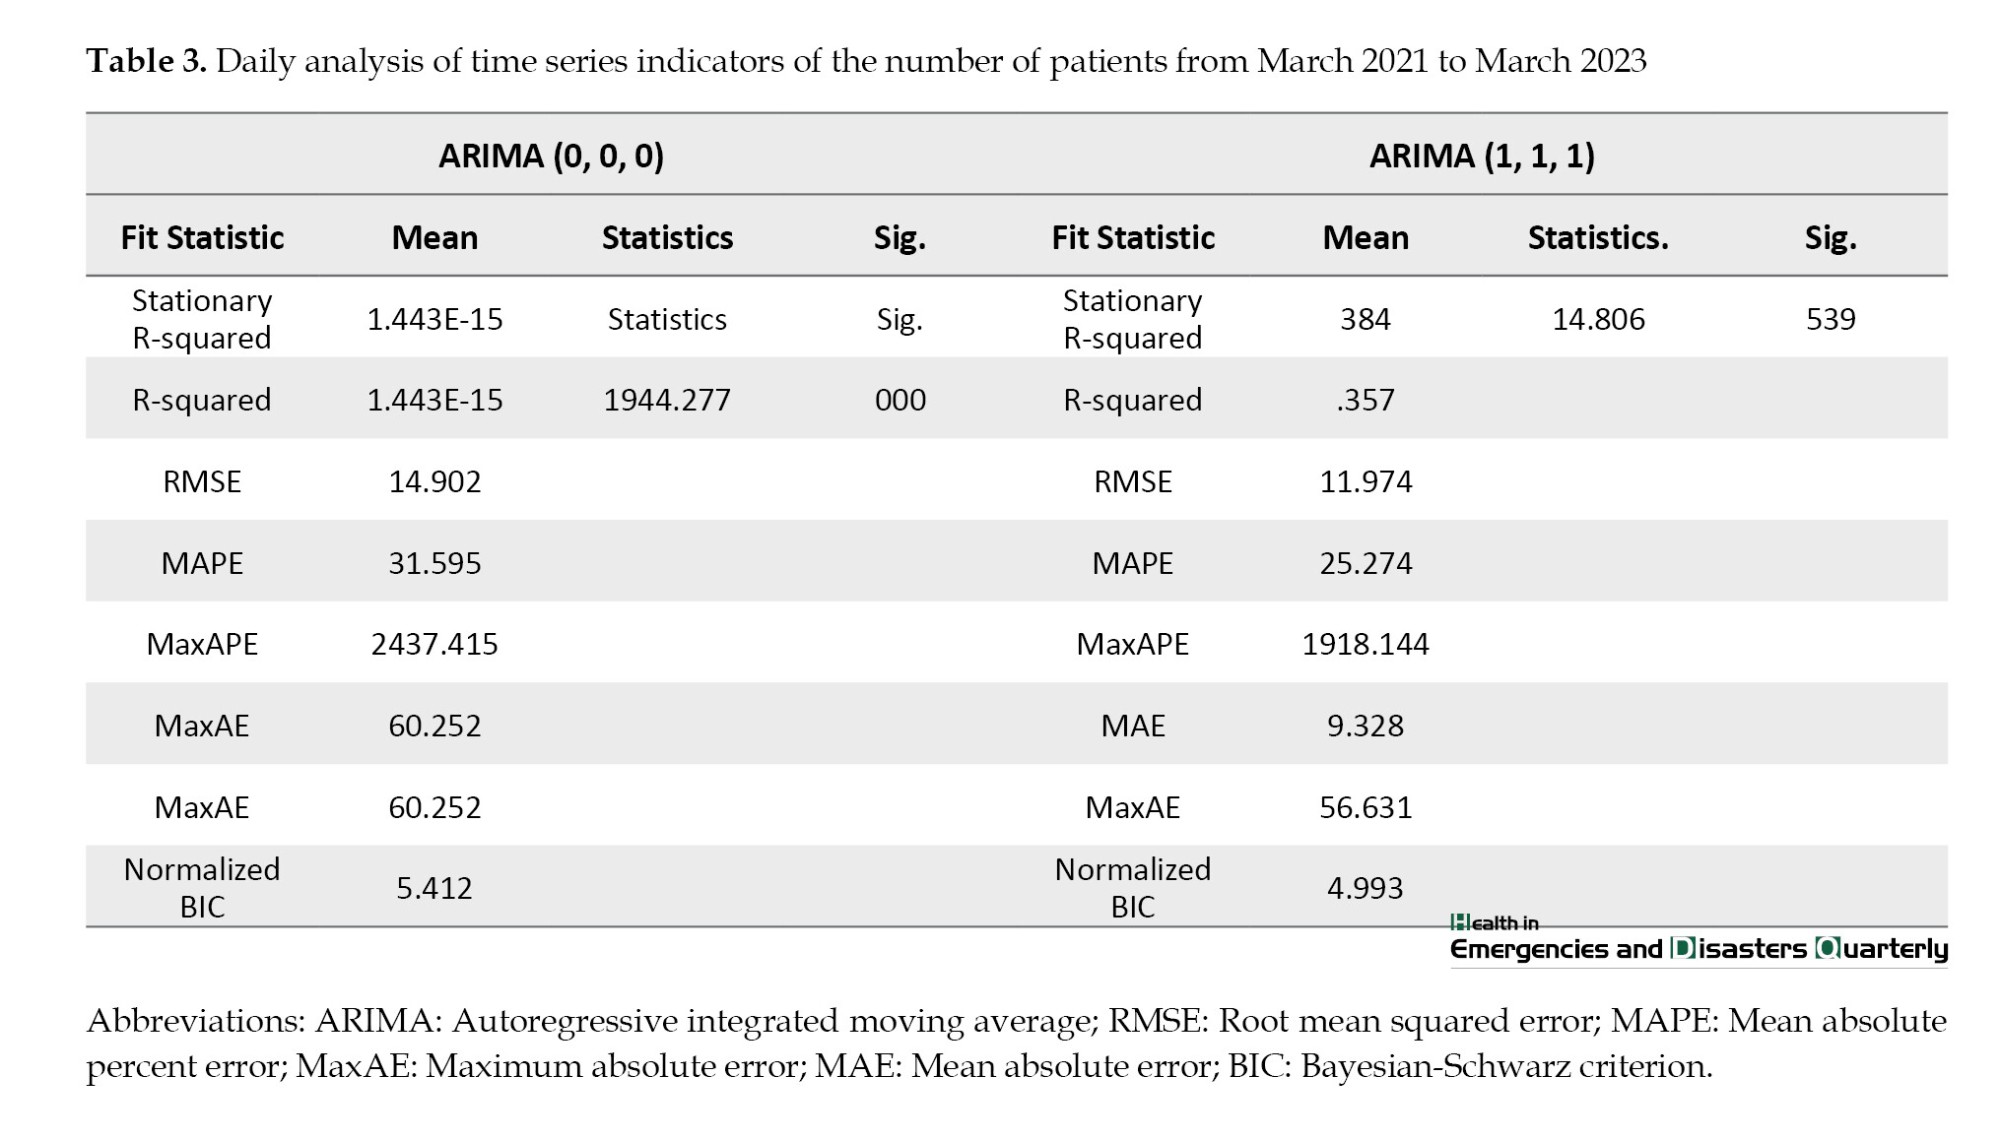
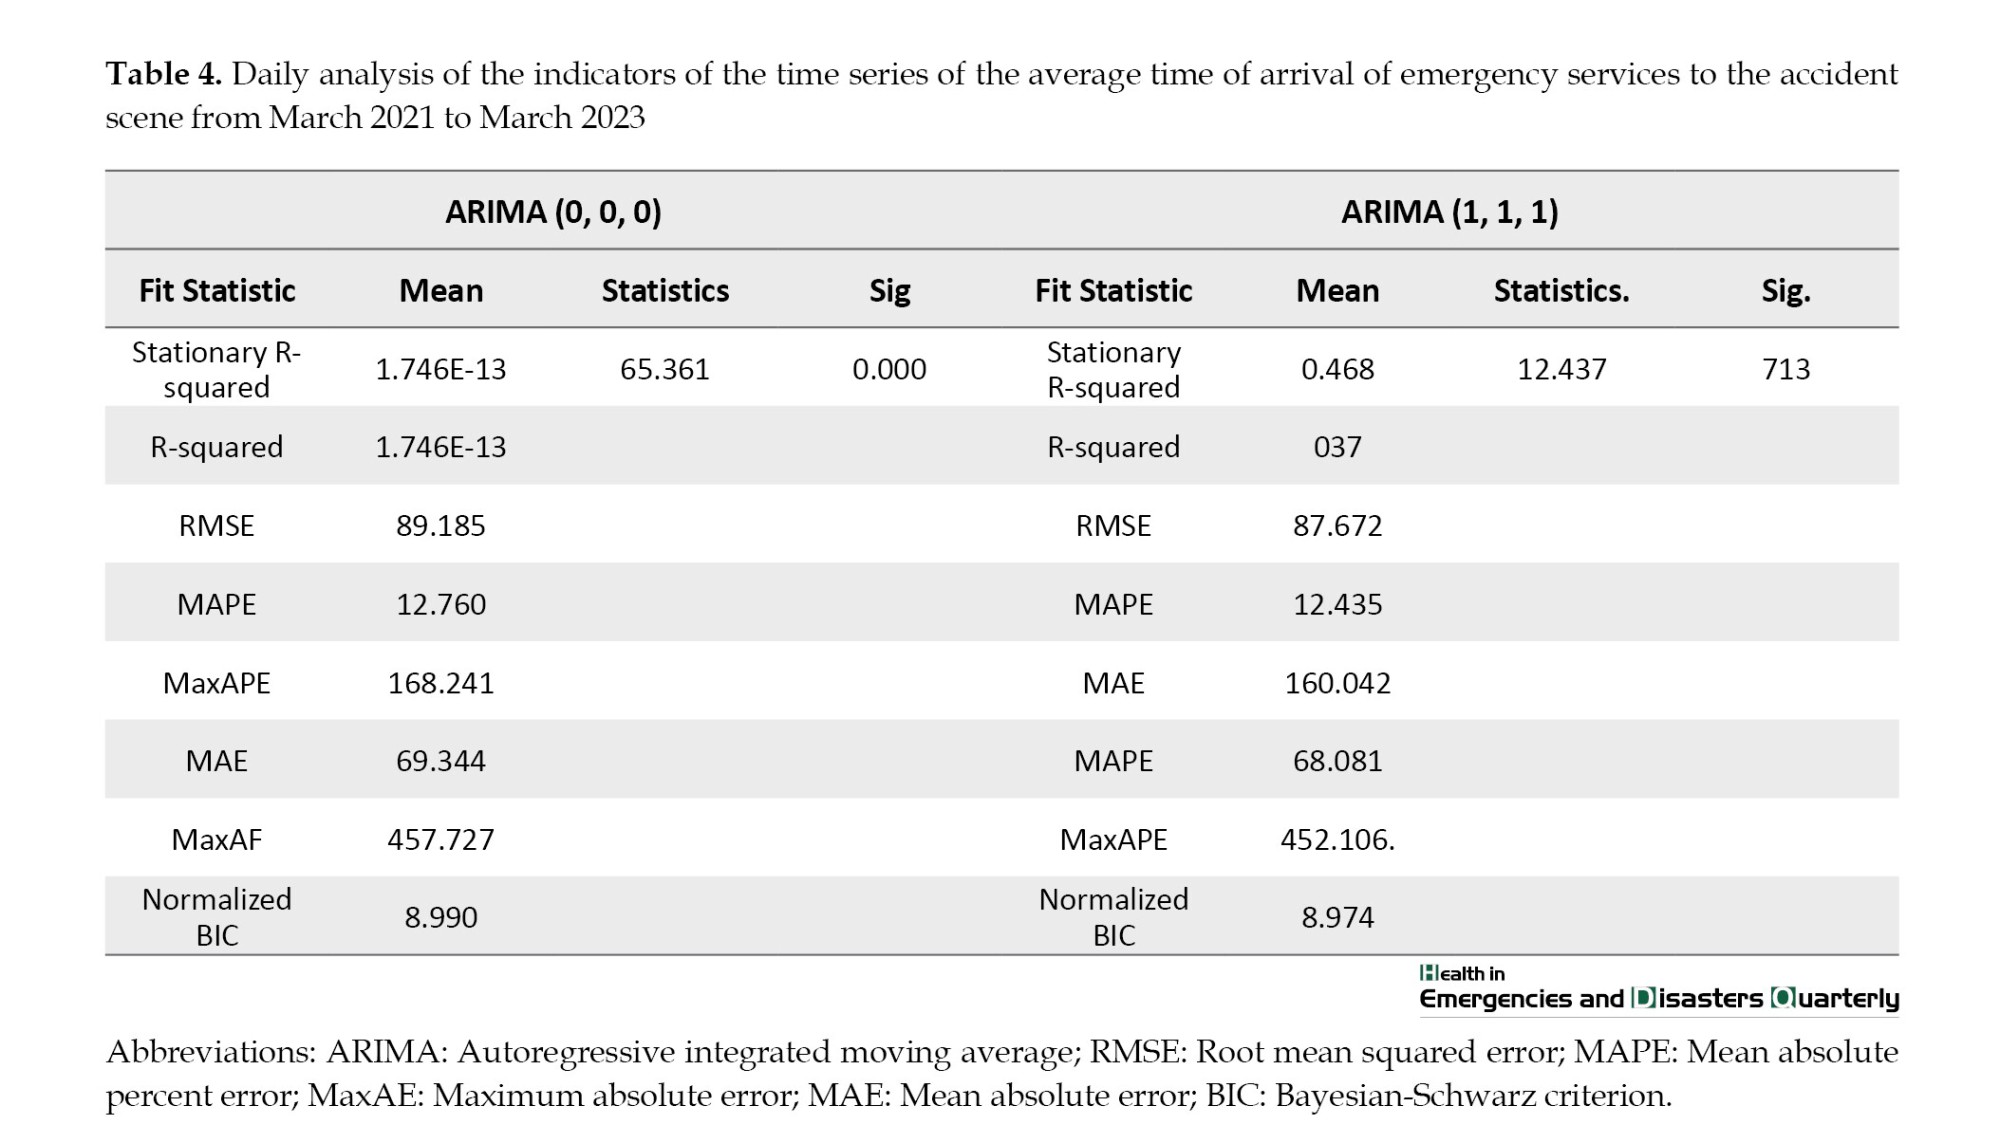
In step 3, we calculated the average daily number of requests and time performance indicators at this stage. The daily mean and median of patients are 43. The explanations related to the report are based on the data of daily patients transferred to medical centers due to accidents from the beginning of March 2021 to March 2023. They followed the moving autoregressive moving average model (ARIMA) model (0, 0, 0). Using the Ljung-BOX statistical test [10], the daily residual of the data shows that the randomness of the data is significant (P<0.05). When differentiating the ARIMA (1, 1, 1) using the Ljung-BOX statistical test [10], it is significant (P<0.05). The average time of arrival of emergency services to the accident scene from March 2021 to March 2023 based on the time series functions are reported in the Table 1. It follows the ARIMA model (0, 0, 0) using the Ljung statistical test [10] daily residual of the data; the randomness of the data is significant (P<0.05). When differentiating the autoregressive model, the moving average (ARIMA) is (1, 1, 1), using the LJung-BOX statistical test [10], it is at a significant level (P<0.05) (Tables 3 and 4).
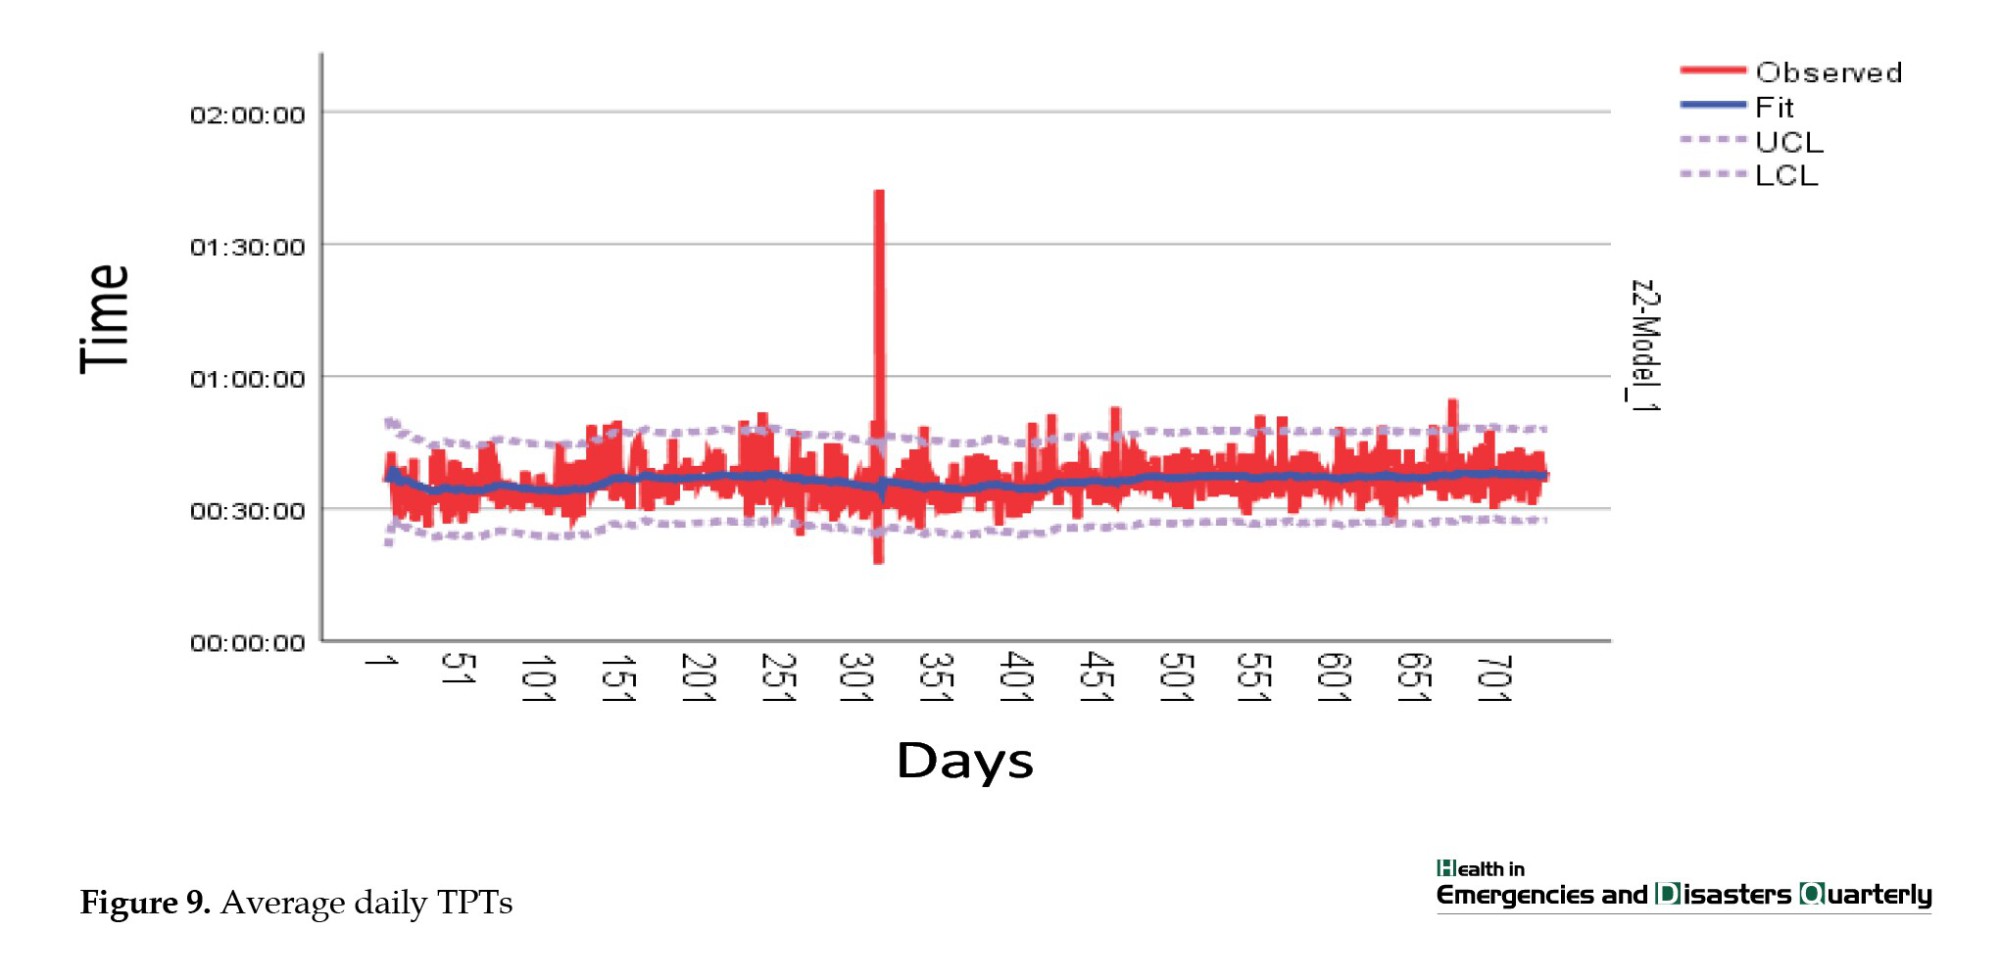
An analysis of information regarding ambulance dispatch calls revealed variations in the number of requests throughout the research period, with a low of 20 and a high of 80. Throughout the study time frame, ambulances typically took 5 to 12 minutes to reach the accident location. In addition, individuals usually stay in the prehospital stage (TPT) for about 28 to 45 minutes on average (Figures 6, 7, 8 and 9).
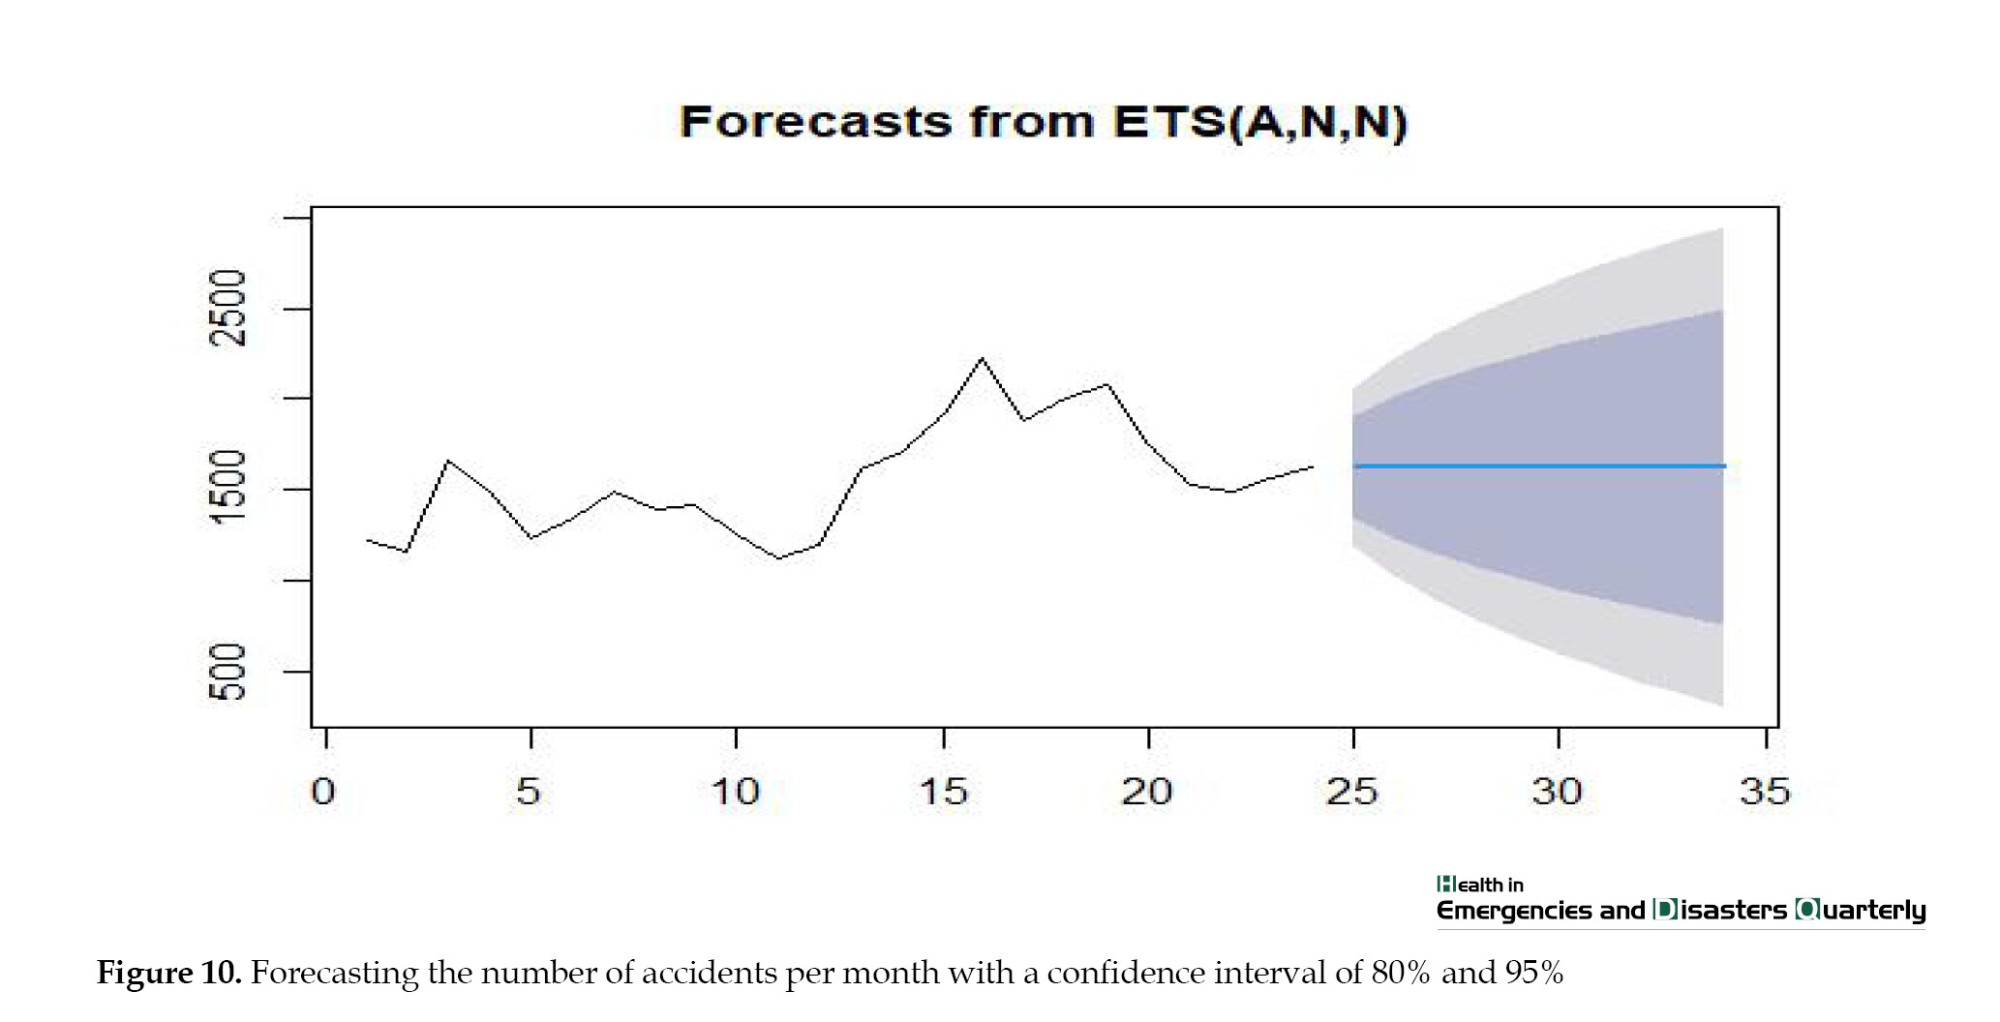
In step 4, we utilized the R software and the forecast package to estimate the future monthly demand for ambulances. We calculated the demand with confidence coefficients of 80% and 95%, reflecting the uncertainty range surrounding the forecasts. The blue line symbolizes the forecasted count of demands, while the shaded region around it indicates the likelihood of events happening within that distance. This provides a sense of the uncertainty associated with our predictions. Our analysis suggests that demand will vary between 2400 and 800 with a 90% confidence level. Additionally, at an 80% confidence level, the demand range is expected to be between 300 and 2800 (Figure 10).
Discussion
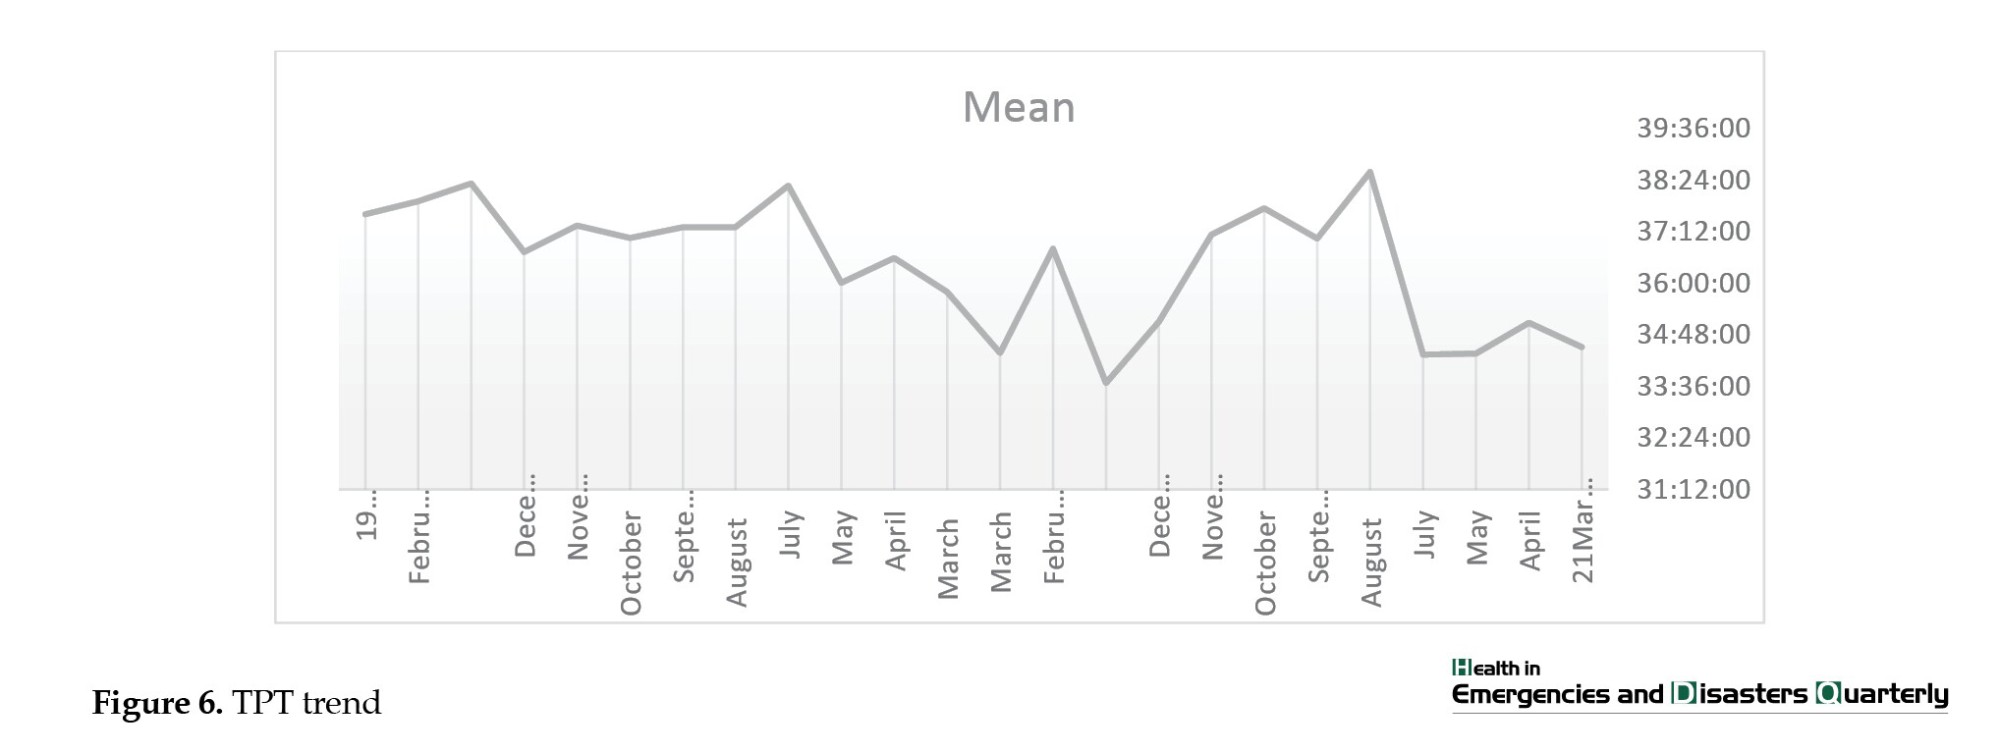
This study focuses on forecasting the ambulance demand in traffic accidents in Golestan Province through time series modeling analysis. Predicting how many service recipients will arrive in the prehospital emergency enhances understanding of the situation and helps manage issues related to overcrowding. In Iran, this research was among the preliminary studies to utilize the time series model for forecasting ambulance needs during traffic accidents in prehospital emergencies. Other studies emphasize that using time series in prehospital emergencies is vital [5, 32, 33]. Our research findings revealed a rising trend in the future use of EMS for traffic accidents. Using ARIMA modeling, we successfully created a precise model for the monthly frequency of prehospital incidents and forecasted the rise in mission volume shortly. Different research highlights that ARIMA models are the best prediction option [31, 34, 35]. This method gives users better results than other seasonal forecasting methods [5, 35]. Our research showed significant fluctuations in the need for ambulances for individuals in traffic accidents throughout the year. During the summer, we noticed an increase in the number of people using our services. Mohammadi et al. study supports our results that summer experiences more injuries than other seasons [13]. One significant result from this research is the ongoing rise in the requests for ambulances following traffic accidents over the two-year study period, indicating a steady upward pattern in the graph. Our analysis shows that ambulance demands for traffic accident injuries may increase from 1500 to 2400 per month in the worst-case scenario and decrease to 800 with preventative measures in the best-case scenario (with a 95% confidence level). Muguro et al. reviewed 5-year data (2015-2020) in Kenya. They found that fatalities and injuries increased by 26% and 46.5%, respectively, from January 2015 to January 2020 [36]. A mortality review in some countries shows a downward trend [37]. Predicting worldwide road traffic injury fatalities for 2030 indicated 1.225 million deaths and 14.3 fatalities per 100000 people in 2030, reflecting a decrease of 1% and 12% compared to the figures from 2017 reported in the global burden of disease study, respectively [38]. In this study, we investigated the prognosis of trauma victims and its relationship with the time intervals before the hospital. We found that longer time intervals were directly related to death in traffic accident victims (Table 2). There is little empirical information on this topic [15]. Several studies reported various associations (negative, neutral, and positive) of the association of mortality with shorter pre-hospital time [14, 16-18]. Our study shows that TPT is longer in July, August, September and October compared to other months, corresponding with the seasonal increase in ambulance demands (Figure 6).
Additionally, the fatality rate among road accident victims is notably higher when the TPT is significantly longer than for urban accident victims (Table 1). Our study aligns with the findings of Fatovich et al. as well. During their research on trauma patients in urban and rural areas of Western Australia, they discovered that the rural population had double the risk of death compared to urban trauma patients. The average time to definitive care was longer for the rural population [16]. On the other hand, the study of Baqher et al. showed that the time at the scene (average of 17 minutes) and the total time before the hospital (average of 35 minutes) do not affect mortality among urban prehospital transport in Scandinavia [17]. Brown et al. found an association between a long time at the scene and mortality, regardless of the mode of transport (air or ground) [18]. Harmsen et al. found that rapid transportation is advantageous for individuals experiencing neurotrauma and those hemodynamically unstable due to penetrating injuries. For hemodynamically stable trauma patients without a specific diagnosis, longer on-scene and TPT do not raise the likelihood of death. For trauma patients without differentiation, the emphasis should be on prehospital care rather than quick transportation [15]. It appears that the primary aim of efforts to lower traffic accident deaths should concentrate on efficiently handling the heightened demands for ambulances during periods with longer total pre-hospital time. Due to limitations in this study, we lack data on the distribution of trauma centers, and patient flow at receiving hospitals, waiting times for services, trauma mechanisms, and air ambulance participation in road incidents. All these factors can impact the prognosis of patients, which could be enhanced by additional research.
Conclusion
We have employed a TSF approach to predict the demand for ambulances for injured individuals in traffic accidents, which can help with resource allocation and planning. By analyzing the historical data, we identified a trend and seasonal patterns in the data, which suggests that there may be an increase in demand during the summer months (associated with increased TPT). Using an 80% and 95% confidence coefficient, we accounted for the uncertainty in our predictions, which is essential for making informed decisions. According to our estimate, demand is expected to fluctuate between 300 and 2800. Predicting the trend of service recipients in the prehospital emergency room can increase situational awareness and help manage the challenges caused by overcrowding. By anticipating the surge in demand for services during peak periods, you can plan to allocate resources effectively and minimize delays.
Ethical Considerations
Compliance with ethical guidelines
This study was approved by the Ethics Committee of Golestan University of Medical Sciences, Gorgan, Iran (Code: IR.GOUMS.REC.1402.127). Informed consent was obtained from all participants included in the study.
Funding
This study was derived from a research project that received approval from Golestan University of Medical Sciences, Gorgan, Iran (Code: 113683).
Authors' contributions
All authors contributed equally to the conception and design of the study, data collection and analysis, interpretation of the results, and drafting of the manuscript. Each author approved the final version of the manuscript for submission.
Conflict of interest
The authors declared no conflict of interest.
Acknowledgments
The researcher would like to thank all the managers and staff from the EMS system who participated in the study.
References
Emergency medical services (EMS) worldwide face significant challenges, mainly due to the impact of road traffic accidents [1]. These incidents include a considerable part of calls to emergency dispatch centers [2]. Providing effective EMS in these incidents requires careful resource planning, which generally relies on forecasting operational, tactical, and strategic demand. Care providers outside the hospital typically face economic and human resource limitations [3]. The primary goal of EMS in these events is to minimize emergency response time while managing operational costs [4]. Failing to match available resources with demand in EMS seriously affects patients, staff, and the entire healthcare system [5, 6]. The imbalanced demand for ambulances in terms of space and time has made EMS physicians dependent on predicting the volume of care to develop staffing and dynamic deployment plans [7]. Robust forecasting will allow sound decisions for capacity and staffing levels. Accurate forecasting of the demand and optimal management of the ambulance fleet can increase the chance of the injured’s survival and the system’s efficiency. An efficient medical emergency system has led to numerous studies in this field [8, 9]. Estimating the association between resources and demand in EMS is crucial to ensure timely and effective response to emergencies, such as road traffic accidents [10, 11]. In contrast to the typical methods employed by research centers that often rely on descriptive techniques and focus on presenting reports with graphs, it is crucial to establish a suitable model for predicting and assessing outcomes [12].
Nevertheless, certain potential biases may result in inaccurate predictions and inadequate resource distribution. As a result of using a faulty model, there is a risk of inaccurately estimating demand due to the failure to appropriately represent the connections between demand and resources. This may lead to improper distribution of resources and unsatisfactory results [13-18]. Various forecasting methods are used in the health system, including historical averaging, smoothing techniques, linear regression and autoregressive integrated moving average (ARIMA) modeling [19-24]. Generally, two main streams of research are related to forecasting ambulance demand in EMS. The first stream focuses on applying time series methods and regression approaches to forecasting aggregate ambulance demand [25, 26]. The second stream enables the forecasting of EMS demand using spatiotemporal forecasting methods [4]. There are many studies on applying time series forecasting (TSF) in EMS [27, 28]. The TSF predicts system behavior by utilizing both current and past data. TSF addresses real-world issues, including traffic systems, oil market dynamics, weather predictions and financial markets [29]. The examination and prediction of time series typically rely on ARIMA models and their different variations [30]. However, research highlights that utilizing suitable time series models is the best option for prediction [31]. The time series methods give users better results than other statistical methods for seasonal forecasts in EMS [5]. This outcome may be because time series models monitor key performance indicators that can be a powerful tool for organizations to gain insights and make data-driven decisions. By analyzing historical data and using time series models to predict future trends and patterns, organizations can identify potential issues before they become major problems [10]. Hence in this study, we intend to use a time series model to estimate demand ambulance in traffic accidents in the emergency medical system to help managers to optimize resource allocation and response times.
Materials and Methods
Sample and study design
A retrospective cohort study was conducted on ambulance demands for traffic accidents in the Golestan Province of Iran from March 2021 to March 2023. In this research, we conducted a longitudinal analysis of calls that resulted in ambulance dispatch during traffic accidents. These studies aid in creating and executing more efficient preventive strategies to enhance ambulance demand management. All individuals involved in traffic accidents who were taken to a hospital by EMS were part of the study’s statistical population. All the ambulances sent out for traffic injuries were chosen using the census method. The information was derived from the prehospital care report. These data included the request time and the EMS’s reaction times (RT). We used performance indicators in the form of time series data to effectively monitor prehospital emergency services. Two measurements, RT and total prehospital time (TPT), were utilized in a temporal sequence. We used statistical methods to present the performance indicators individually.
Forecasting approach
The individual forecasting time series model is a standard and straightforward method. We assume the coming days will be the same as the previous ones. In other words, we use the empirical distribution of past daily accidents to create a predictive distribution of future accidents. At first, the data were smoothed by removing flows and seasonal changes. To remove the tides or long-term changes in the average, we used the one-step differential method and to remove the seasonal changes, we used the Box-Cox transformation to create stability in the variance. Then, we fitted a suitable time series model to the smoothed data. With data availability or smoothed past events, we use it as a key to make reliable predictions. The final data results forecast the expected demand for ambulances for traffic accidents in the upcoming years. We used R statistical software, version 4.5.0 and the forecast package.
Results
Descriptive statistical analysis
Throughout the study period, 37409 requests were recorded for traffic accidents. Since it is sensitive data, it does not include personal or postcode information. Our findings indicate that, according to the chi-square test, there is a significantly higher number of injuries and deaths in men compared to women (P<0.05). It is noted that accidents occur more frequently during the day than at night. Nonetheless, fatal accidents are more common at night compared to daytime (P˂0.05). After analyzing accident locations, it was discovered that urban transportation accidents result in more injuries than road accidents, yet road accidents have a higher fatality rate (P˂0.05). The t-test analysis indicates a significant difference in EMS arrival time at accident scenes based on location (city or roads) (Table 1).
The data indicates that the TPT within the city differs from the TPT on the road. The noted distinction is statistically meaningful and can be deemed genuine (P˂0.05). This result suggests that traffic congestion, road conditions, and infrastructure affect TPT in urban and rural areas. The research findings could help guide choices regarding transportation planning, urban design, and traffic management approaches to enhance TPT both in the city and on the highway (Table 2).
Time series analysis
In step 1, the study was conducted at a daily time-series level. Each observation represents the daily count of emergency calls that resulted in the dispatch of one or more emergency ambulances. By plotting the time series graph in Figure 1, we found flow or long-term changes in the average. The time series average has a trend or exhibits long-term changes over time. This outcome could indicate underlying factors, such as seasonality, growth, or resource decline. There were also more random fluctuations in the data during the summer months compared to other months. This result could be due to various reasons, such as changes in demand, availability of resources, or external factors. Further, more accidents occurred in the summer of 2023 than in the summer of 2021.
This means that the data shows seasonal changes. We first made the data stationary to determine which time series model the accident data follows. Then, we plotted the autocorrelation and partial autocorrelation coefficients (ACF) of these data regarding delay. Autocorrelation measures the correlation between a time series and its past values, while partial autocorrelation measures the correlation between a time series and its past values after controlling for intermediate values. We used the data differentiation method to fix data stationarity. We transformed the non-stationarity of a time series into a stationary series by differentiating and stabilizing its variance by box-cox transformation (Figures 1, 2 and 3).
In step 2, we differentiated the data once and performed the augmented dickey-fuller test. The associated P is below the threshold, leading to the rejection of the null hypothesis. Consequently, evidence suggests that the one-step differentiated data is stationary. We then drew graphs of autocorrelation and partial ACF (Figures 4 and 5). We found that the data follows the ARIMA model (1, 1, 5).
In step 3, we calculated the average daily number of requests and time performance indicators at this stage. The daily mean and median of patients are 43. The explanations related to the report are based on the data of daily patients transferred to medical centers due to accidents from the beginning of March 2021 to March 2023. They followed the moving autoregressive moving average model (ARIMA) model (0, 0, 0). Using the Ljung-BOX statistical test [10], the daily residual of the data shows that the randomness of the data is significant (P<0.05). When differentiating the ARIMA (1, 1, 1) using the Ljung-BOX statistical test [10], it is significant (P<0.05). The average time of arrival of emergency services to the accident scene from March 2021 to March 2023 based on the time series functions are reported in the Table 1. It follows the ARIMA model (0, 0, 0) using the Ljung statistical test [10] daily residual of the data; the randomness of the data is significant (P<0.05). When differentiating the autoregressive model, the moving average (ARIMA) is (1, 1, 1), using the LJung-BOX statistical test [10], it is at a significant level (P<0.05) (Tables 3 and 4).
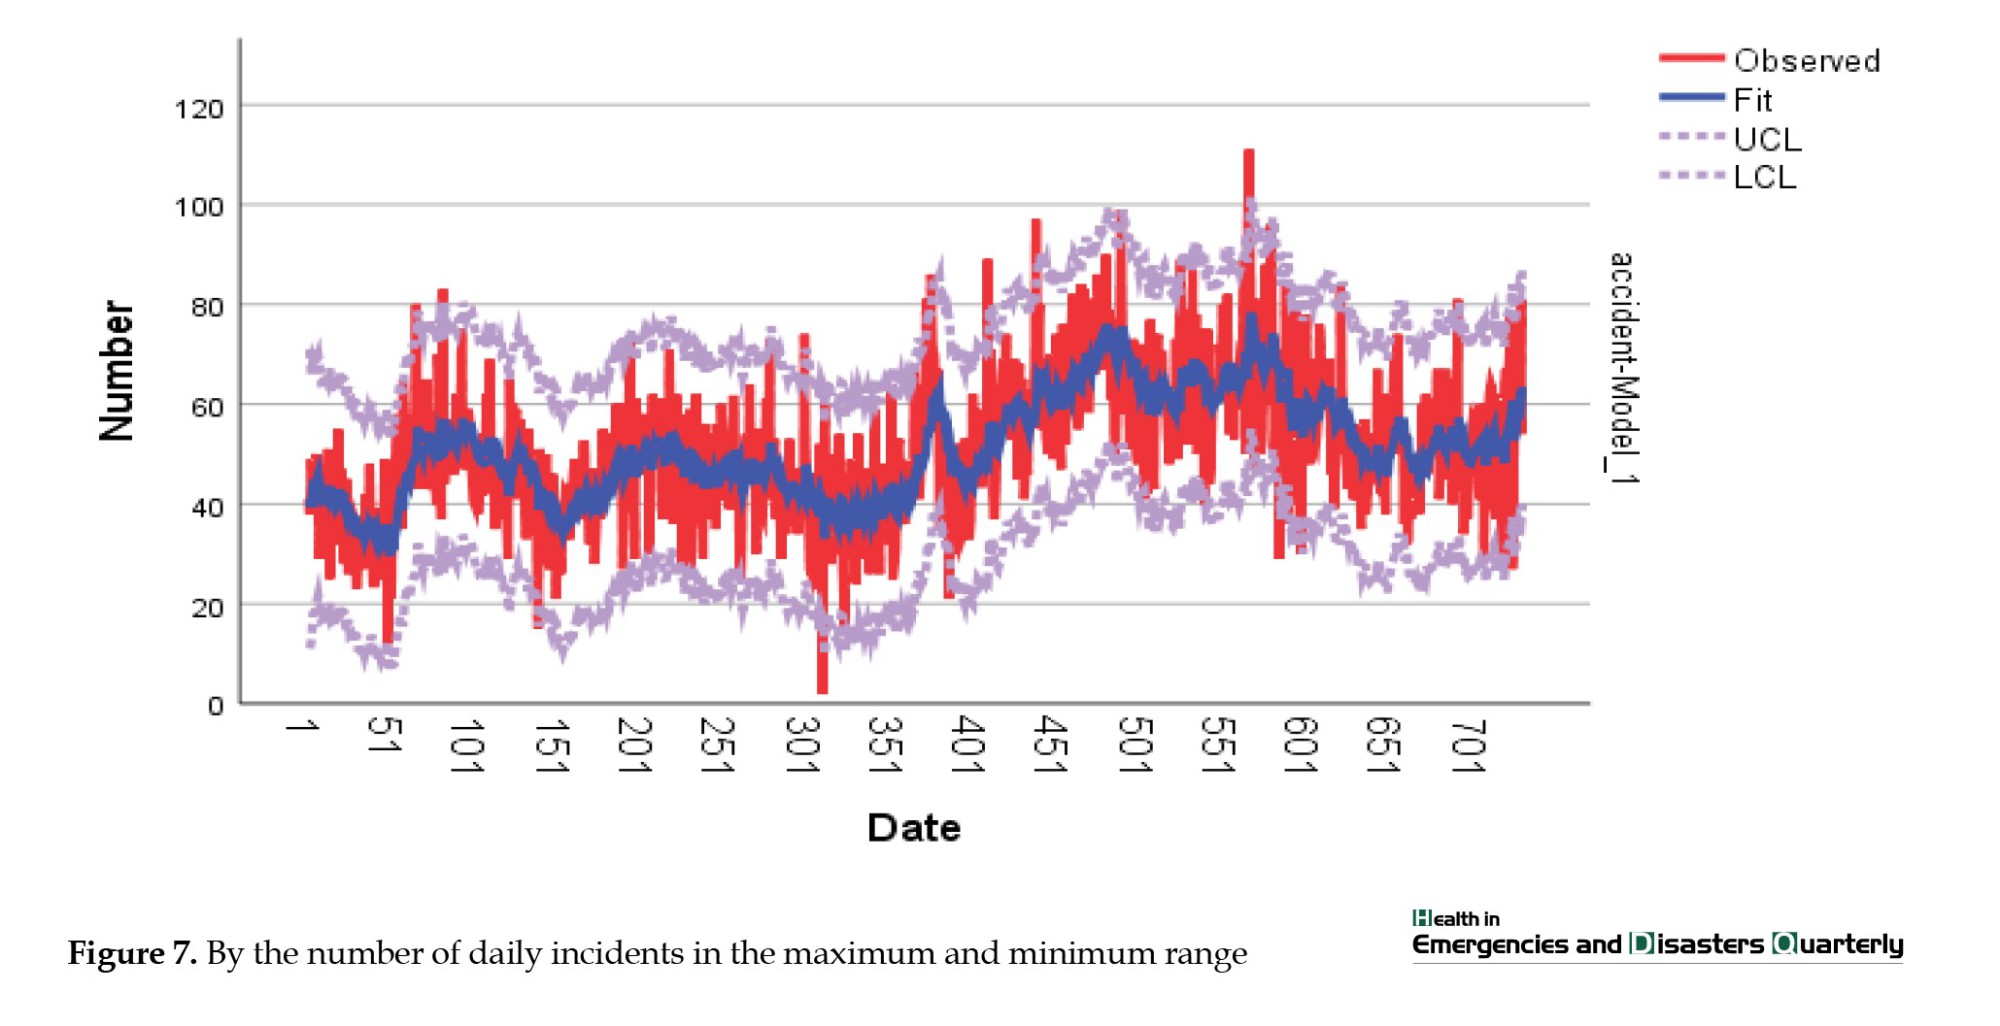
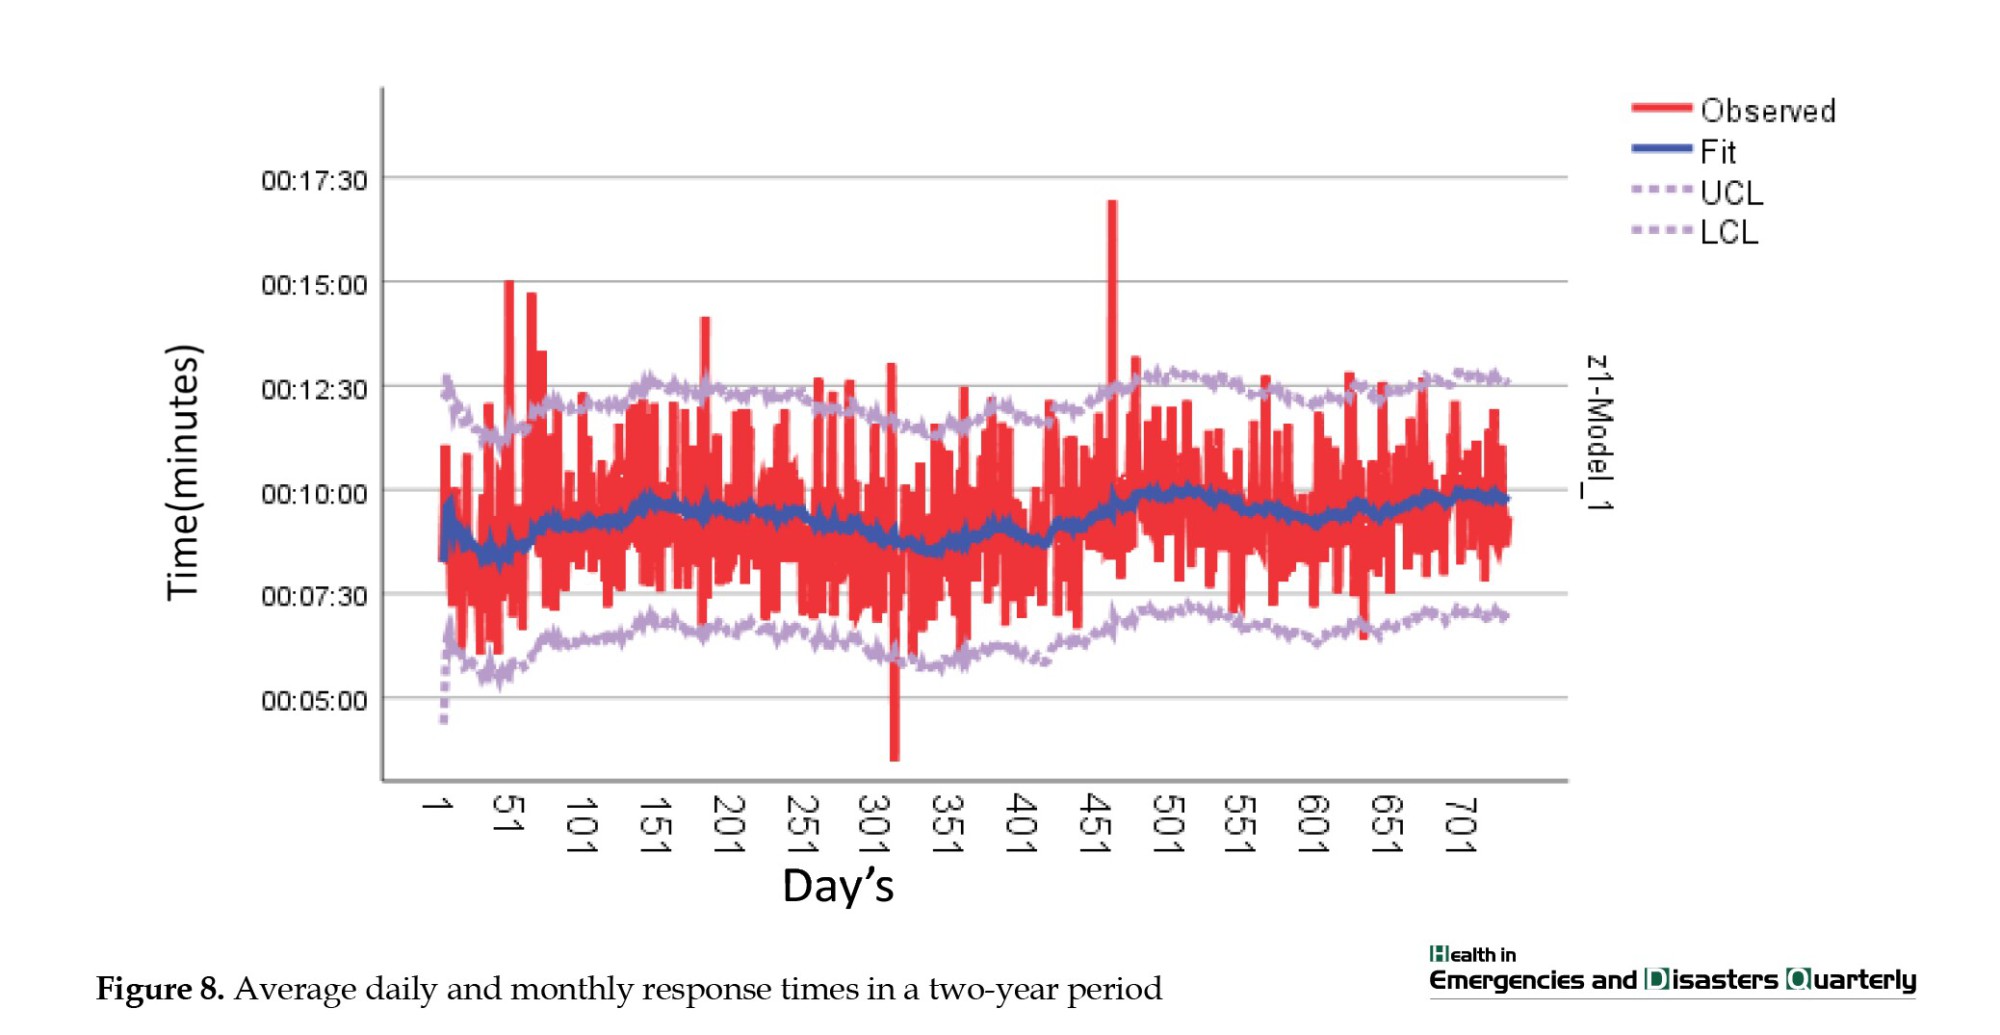
An analysis of information regarding ambulance dispatch calls revealed variations in the number of requests throughout the research period, with a low of 20 and a high of 80. Throughout the study time frame, ambulances typically took 5 to 12 minutes to reach the accident location. In addition, individuals usually stay in the prehospital stage (TPT) for about 28 to 45 minutes on average (Figures 6, 7, 8 and 9).
In step 4, we utilized the R software and the forecast package to estimate the future monthly demand for ambulances. We calculated the demand with confidence coefficients of 80% and 95%, reflecting the uncertainty range surrounding the forecasts. The blue line symbolizes the forecasted count of demands, while the shaded region around it indicates the likelihood of events happening within that distance. This provides a sense of the uncertainty associated with our predictions. Our analysis suggests that demand will vary between 2400 and 800 with a 90% confidence level. Additionally, at an 80% confidence level, the demand range is expected to be between 300 and 2800 (Figure 10).
Discussion
This study focuses on forecasting the ambulance demand in traffic accidents in Golestan Province through time series modeling analysis. Predicting how many service recipients will arrive in the prehospital emergency enhances understanding of the situation and helps manage issues related to overcrowding. In Iran, this research was among the preliminary studies to utilize the time series model for forecasting ambulance needs during traffic accidents in prehospital emergencies. Other studies emphasize that using time series in prehospital emergencies is vital [5, 32, 33]. Our research findings revealed a rising trend in the future use of EMS for traffic accidents. Using ARIMA modeling, we successfully created a precise model for the monthly frequency of prehospital incidents and forecasted the rise in mission volume shortly. Different research highlights that ARIMA models are the best prediction option [31, 34, 35]. This method gives users better results than other seasonal forecasting methods [5, 35]. Our research showed significant fluctuations in the need for ambulances for individuals in traffic accidents throughout the year. During the summer, we noticed an increase in the number of people using our services. Mohammadi et al. study supports our results that summer experiences more injuries than other seasons [13]. One significant result from this research is the ongoing rise in the requests for ambulances following traffic accidents over the two-year study period, indicating a steady upward pattern in the graph. Our analysis shows that ambulance demands for traffic accident injuries may increase from 1500 to 2400 per month in the worst-case scenario and decrease to 800 with preventative measures in the best-case scenario (with a 95% confidence level). Muguro et al. reviewed 5-year data (2015-2020) in Kenya. They found that fatalities and injuries increased by 26% and 46.5%, respectively, from January 2015 to January 2020 [36]. A mortality review in some countries shows a downward trend [37]. Predicting worldwide road traffic injury fatalities for 2030 indicated 1.225 million deaths and 14.3 fatalities per 100000 people in 2030, reflecting a decrease of 1% and 12% compared to the figures from 2017 reported in the global burden of disease study, respectively [38]. In this study, we investigated the prognosis of trauma victims and its relationship with the time intervals before the hospital. We found that longer time intervals were directly related to death in traffic accident victims (Table 2). There is little empirical information on this topic [15]. Several studies reported various associations (negative, neutral, and positive) of the association of mortality with shorter pre-hospital time [14, 16-18]. Our study shows that TPT is longer in July, August, September and October compared to other months, corresponding with the seasonal increase in ambulance demands (Figure 6).
Additionally, the fatality rate among road accident victims is notably higher when the TPT is significantly longer than for urban accident victims (Table 1). Our study aligns with the findings of Fatovich et al. as well. During their research on trauma patients in urban and rural areas of Western Australia, they discovered that the rural population had double the risk of death compared to urban trauma patients. The average time to definitive care was longer for the rural population [16]. On the other hand, the study of Baqher et al. showed that the time at the scene (average of 17 minutes) and the total time before the hospital (average of 35 minutes) do not affect mortality among urban prehospital transport in Scandinavia [17]. Brown et al. found an association between a long time at the scene and mortality, regardless of the mode of transport (air or ground) [18]. Harmsen et al. found that rapid transportation is advantageous for individuals experiencing neurotrauma and those hemodynamically unstable due to penetrating injuries. For hemodynamically stable trauma patients without a specific diagnosis, longer on-scene and TPT do not raise the likelihood of death. For trauma patients without differentiation, the emphasis should be on prehospital care rather than quick transportation [15]. It appears that the primary aim of efforts to lower traffic accident deaths should concentrate on efficiently handling the heightened demands for ambulances during periods with longer total pre-hospital time. Due to limitations in this study, we lack data on the distribution of trauma centers, and patient flow at receiving hospitals, waiting times for services, trauma mechanisms, and air ambulance participation in road incidents. All these factors can impact the prognosis of patients, which could be enhanced by additional research.
Conclusion
We have employed a TSF approach to predict the demand for ambulances for injured individuals in traffic accidents, which can help with resource allocation and planning. By analyzing the historical data, we identified a trend and seasonal patterns in the data, which suggests that there may be an increase in demand during the summer months (associated with increased TPT). Using an 80% and 95% confidence coefficient, we accounted for the uncertainty in our predictions, which is essential for making informed decisions. According to our estimate, demand is expected to fluctuate between 300 and 2800. Predicting the trend of service recipients in the prehospital emergency room can increase situational awareness and help manage the challenges caused by overcrowding. By anticipating the surge in demand for services during peak periods, you can plan to allocate resources effectively and minimize delays.
Ethical Considerations
Compliance with ethical guidelines
This study was approved by the Ethics Committee of Golestan University of Medical Sciences, Gorgan, Iran (Code: IR.GOUMS.REC.1402.127). Informed consent was obtained from all participants included in the study.
Funding
This study was derived from a research project that received approval from Golestan University of Medical Sciences, Gorgan, Iran (Code: 113683).
Authors' contributions
All authors contributed equally to the conception and design of the study, data collection and analysis, interpretation of the results, and drafting of the manuscript. Each author approved the final version of the manuscript for submission.
Conflict of interest
The authors declared no conflict of interest.
Acknowledgments
The researcher would like to thank all the managers and staff from the EMS system who participated in the study.
References
- Mohajervatan A, Ashabi M, Rezaei F. Investigating emergency medical system challenges in mass casualty incidents: a case report study in road traffic accidents in Northern Iran. Health in Emergencies and Disasters Quarterly. 2024; 9(3):239-46. [DOI:10.32598/hdq.9.3.149.5]
- Azami-Aghdash S, Moosavi A, Gharaee H, Sadeghi G, Mousavi Isfahani H, Ghasemi Dastgerdi A, et al. Development of quality indicators to measure pre-hospital emergency medical services for road traffic injury. BMC Health Services Research. 2021; 21(1):235. [DOI:10.1186/s12913-021-06238-1] [PMID]
- Garza AG, Gratton MC, Chen JJ, Carlson B. The accuracy of predicting cardiac arrest by emergency medical services dispatchers: The calling party effect. Academic Emergency Medicine. 2003; 10(9):955-60. [DOI:10.1197/S1069-6563(03)00314-2] [PMID]
- Zhou Z, Matteson DS. Predicting Melbourne ambulance demand using kernel warping. Annals of Applied Statistics. 2016; 10(4):1977-96. [DOI:10.1214/16-AOAS961]
- Rostami-Tabar B, Hyndman RJ. Hierarchical time series forecasting in emergency medical services. Journal of Service Research. 2024; 28(2):10946705241232169. [DOI:10.1177/10946705241232169]
- Rostami-Tabar B, Ziel F. Anticipating special events in emergency department forecasting. International Journal of Forecasting. 2022; 38(3):1197-213. [DOI:10.1016/j.ijforecast.2020.01.001]
- Khorasani-Zavareh D, Mohammadi R, Bohm K. Factors influencing pre-hospital care time intervals in Iran: A qualitative study. Journal of Injury & Violence Research. 2018; 10(2):83-90. [DOI:10.5249/jivr.v10i2.953] [PMID]
- Nickel S, Reuter-Oppermann M, Saldanha-da-Gama F. Ambulance location under stochastic demand: A sampling approach. Operations Research for Health Care. 2016; 8:24-32. [DOI:10.1016/j.orhc.2015.06.006]
- Leknes H, Aartun ES, Andersson H, Christiansen M, Granberg TA. Strategic ambulance location for heterogeneous regions. European Journal of Operational Research. 2017; 260(1):122-33. [DOI:10.1016/j.ejor.2016.12.020]
- Hulshof PJ, Kortbeek N, Boucherie RJ, Hans EW, Bakker PJ. Taxonomic classification of planning decisions in health care: A structured review of the state of the art in OR/MS. Health systems. 2012; 1(2):129-75. [DOI:10.1057/hs.2012.18]
- Farzad P, Khatami M, Azizabadi Faraahani M, Khodami V, Asaari S. Time indices of pediatric prehospital emergency care in Tehran, 2006. Razi Journal of Medical Sciences. 2008; 69-80. [Link]
- Zhang Y, Zhou H, Zhou J, Sun W. Regression models for multivariate count data. Journal of Computational and Graphical Statistics. 2017; 26(1):1-13. [DOI:10.1080/10618600.2016.1154063] [PMID]
- Mohammadi A, Haydari A, Shabani N, Alipour J. Analysis of crashes and emergency medical services resources using geospatial information system on Western suburban roads of Iran. Informatics in Medicine Unlocked. 2021; 27:100786. [DOI:10.1016/j.imu.2021.100786]
- Al-Zabidi A, Almannaa M, Elhenawy M, Gharbi A. Statistical modeling of emergency medical services’ response and rescue times to road traffic crashes in the Kingdom of Saudi Arabia. Case Studies on Transport Policy. 2022; 10(4):2563-75. [DOI:10.1016/j.cstp.2022.11.009]
- Harmsen A, Giannakopoulos GF, Moerbeek PR, Jansma EP, Bonjer H, Bloemers FW. The influence of prehospital time on trauma patients outcome: A systematic review. Injury. 2015; 46(4):602-9. [DOI:10.1016/j.injury.2015.01.008] [PMID]
- Fatovich DM, Phillips M, Langford SA, Jacobs IG. A comparison of metropolitan vs rural major trauma in Western Australia. Resuscitation. 2011; 82(7):886-90. [DOI:10.1016/j.resuscitation.2011.02.040] [PMID]
- Bagher A, Todorova L, Andersson L, Wingren CJ, Ottosson A, Wangefjord S, et al. Analysis of pre-hospital rescue times on mortality in trauma patients in a Scandinavian urban setting. Trauma. 2017; 19(1):28-34. [DOI:10.1177/1460408616649217]
- Brown JB, Rosengart MR, Forsythe RM, Reynolds BR, Gestring ML, Hallinan WM, et al. Not all prehospital time is equal: Influence of scene time on mortality. Journal of Trauma and Acute Care Surgery. 2016; 81(1):93-100. [DOI:10.1097/TA.0000000000000999] [PMID]
- Schweigler LM, Desmond JS, McCarthy ML, Bukowski KJ, Ionides EL, Younger JG. Forecasting models of emergency department crowding. Academic Emergency Medicine. 2009; 16(4):301-8. [DOI:10.1111/j.1553-2712.2009.00356.x] [PMID]
- Boyle J, Jessup M, Crilly J, Green D, Lind J, Wallis M, et al. Predicting emergency department admissions. Emergency Medicine Journal. 2012; 29(5):358-65. [DOI:10.1136/emj.2010.103531] [PMID]
- Champion R, Kinsman LD, Lee GA, Masman KA, May EA, Mills TM, et al. Forecasting emergency department presentations. Australian Health Review. 2007; 31(1):83-90. [DOI:10.1071/AH070083] [PMID]
- Takase M, Carlin J. Modelling seasonal variations in presentations at a paediatric emergency department. Hiroshima Journal of Medical Sciences. 2012;61(3):51-8. [PMID]
- Sun Y, Heng BH, Seow YT, Seow E. Forecasting daily attendances at an emergency department to aid resource planning. BMC Emergency Medicine. 2009; 9:1-9. [DOI:10.1186/1471-227X-9-1] [PMID]
- Earnest A, Chen MI, Ng D, Sin LY. Using autoregressive integrated moving average (ARIMA) models to predict and monitor the number of beds occupied during a SARS outbreak in a tertiary hospital in Singapore. BMC Health Services Research. 2005; 5:1-8. [DOI:10.1186/1472-6963-5-36] [PMID]
- Sasaki S, Comber AJ, Suzuki H, Brunsdon C. Using genetic algorithms to optimise current and future health planning-the example of ambulance locations. International Journal of Health Geographics. 2010; 9:1-10. [DOI:10.1186/1476-072X-9-4] [PMID]
- Vile JL, Gillard JW, Harper PR, Knight VA. Predicting ambulance demand using singular spectrum analysis. Journal of the Operational Research Society. 2012; 63(11):1556-65. [DOI:10.1057/jors.2011.160]
- Ibrahim R, Ye H, L’Ecuyer P, Shen H. Modeling and forecasting call center arrivals: A literature survey and a case study. International Journal of Forecasting. 2016; 32(3):865-74. [DOI:10.1016/j.ijforecast.2015.11.012]
- Diaz-Hierro J, Martín JM, Arenas ÁV, Gonzalez M, Arevalo J, González CV. Evaluation of time-series models for forecasting demand for emergency health care services. Emergencias. 2012; 24(3):181-8. [Link]
- Lee RS. Chaotic type-2 transient-fuzzy deep neuro-oscillatory network (CT2TFDNN) for worldwide financial prediction. IEEE Transactions on Fuzzy Systems. 2019; 28(4):731-45. [DOI:10.1109/TFUZZ.2019.2914642]
- Box GE, Jenkins GM, Reinsel GC, Ljung GM. Time series analysis: Forecasting and control. Hoboken: John Wiley & Sons; 2015. [Link]
- Sen P, Roy M, Pal P. Application of ARIMA for forecasting energy consumption and GHG emission: A case study of an Indian pig iron manufacturing organization. Energy. 2016; 116:1031-8. [DOI:10.1016/j.energy.2016.10.068]
- Villani M, Earnest A, Nanayakkara N, Smith K, De Courten B, Zoungas S. Time series modelling to forecast prehospital EMS demand for diabetic emergencies. BMC Health Services Research. 2017; 17(1):332. [DOI:10.1186/s12913-017-2280-6] [PMID]
- Bizjak M, Štumberger G, Žalik B, Lukač N, editors. Time series prediction for EMS with machine learning. Paper presented at: 2019 International Conference on Engineering, Science, and Industrial Applications (ICESI); 24 August 2019; Tokyo, Japan. [DOI:10.1109/ICESI.2019.8863006]
- Hendi HG, Ibrahim MH, Farrag MH. An optimized arima model for emergency medical services time series demand forecasting using bayesian methods. 2024; [Unpublished]. [DOI:10.21203/rs.3.rs-4785386/v1]
- Sousa Lira JM, Gomes Salgado E, Alberto Beijo L. ARIMA models as an alternative to predict the diffusion of the ISO 14001 standard in Europe. Journal of Environmental Planning and Management. 2020; 63(2):275-86. [DOI:10.1080/09640568.2019.1577721]
- Muguro JK, Sasaki M, Matsushita K, Njeri W. Trend analysis and fatality causes in Kenyan roads: A review of road traffic accident data between 2015 and 2020. Cogent Engineering. 2020; 7(1):1797981. [DOI:10.1080/23311916.2020.1797981]
- Zhang S, Zhang H, Wang Z, Wang D, Jiang G. Analysis on mortality trends of road traffic injury in Tianjin, 2000-2019. Zhonghua liu Xing Bing xue za zhi. 2021; 42(11):2018-23. [DOI:10.3760/cma.j.cn112338-20201224-01439] [PMID]
- Inada H, Li Q, Bachani A, Hyder AA. Forecasting global road traffic injury mortality for 2030. Injury Prevention. 2020; 26(4):339-43. [DOI:10.1136/injuryprev-2019-043336] [PMID]
Type of article: Research |
Subject:
Emergency
Received: 2024/08/10 | Accepted: 2025/01/5 | Published: 2025/07/9
Received: 2024/08/10 | Accepted: 2025/01/5 | Published: 2025/07/9
Send email to the article author
| Rights and permissions | |
 |
This work is licensed under a Creative Commons Attribution-NonCommercial 4.0 International License. |

Copyright © The Author(s);
This is an open access article distributed under the terms of the Creative Commons Attribution-NonCommercial 4.0 (CC-By-NC 4.0), which permits use, distribution, and reproduction in any medium, provided the original work is properly cited and is not used for commercial purposes.
Contact Information
This is an open access article distributed under the terms of the Creative Commons Attribution-NonCommercial 4.0 (CC-By-NC 4.0), which permits use, distribution, and reproduction in any medium, provided the original work is properly cited and is not used for commercial purposes.
Contact Information
