

Volume 11, Issue 1 (Autumn 2025)
Health in Emergencies and Disasters Quarterly 2025, 11(1): 77-90 |
Back to browse issues page


Download citation:
BibTeX | RIS | EndNote | Medlars | ProCite | Reference Manager | RefWorks
Send citation to:


BibTeX | RIS | EndNote | Medlars | ProCite | Reference Manager | RefWorks
Send citation to:
Gharaee M, Zeraati H, Sadeghi A, Karimi S, Hadei M. Trends and Variability in Diurnal Temperature Range in Khuzestan Province (1990-2022). Health in Emergencies and Disasters Quarterly 2025; 11 (1) :77-90
URL: http://hdq.uswr.ac.ir/article-1-674-en.html
URL: http://hdq.uswr.ac.ir/article-1-674-en.html


1- Department of Health in Emergencies and Disasters, School of Public Health, Tehran University of Medical Sciences, Tehran, Iran. & Climate Change and Health Research Center (CCHRC), Institute for Environmental Research (IER), Tehran University of Medical Sciences, Tehran, Iran.
2- Department of Health in Emergencies and Disasters, School of Public Health, Tehran University of Medical Sciences, Tehran, Iran.
3- Department of Environmental Health Engineering, School of Public Health, Tehran University of Medical Sciences, Tehran, Iran.
4- Department of Health in Emergencies and Disasters, School of Public Health, Tehran University of Medical Sciences, Tehran, Iran. & Center for Air Pollution Research (CAPR), Institute for Environmental Research (IER), Tehran University of Medical Sciences, Tehran, Iran. ,mostafa.hadei@gmail.com
2- Department of Health in Emergencies and Disasters, School of Public Health, Tehran University of Medical Sciences, Tehran, Iran.
3- Department of Environmental Health Engineering, School of Public Health, Tehran University of Medical Sciences, Tehran, Iran.
4- Department of Health in Emergencies and Disasters, School of Public Health, Tehran University of Medical Sciences, Tehran, Iran. & Center for Air Pollution Research (CAPR), Institute for Environmental Research (IER), Tehran University of Medical Sciences, Tehran, Iran. ,
Full-Text [PDF 5700 kb]
(1364 Downloads)
| Abstract (HTML) (2565 Views)
Discussion
The DTR, defined as the difference between daily maximum and minimum temperatures, has significant implications for human health and mortality. This study aimed to evaluate the trends of DTR in 5 cities of Khuzestan Province from 1990 to 2022. Our analysis of data from these five cities reveals notable variations in DTR, showcasing how local climatic conditions can differ markedly even within the same region. Specifically, Abadan exhibited a median DTR ranging from 23.8 to 28.5 °C during the period from 1995 to 2020. This relatively stable yet notably high DTR suggests potential implications for human health and agriculture. Aghajari displayed an even higher median DTR, particularly in 2021, with values soaring between 27.4 and 30.6 °C. Increased DTR is linked to heightened heat stress, which poses serious risks to public health, especially in arid regions [18]. The pronounced increase in DTR in specific cities underscores the necessity for ongoing monitoring and analysis of environmental conditions that lead to such extremes. A study conducted by Akhlaghi-Hosseiny et al. on the trends of DTR in Iran using the AgERA5 dataset demonstrated how urbanization and land-use changes significantly influence local climate conditions, aligning with our findings in Khuzestan. Their research provided evidence of regional disparities in DTR trends and emphasized the importance of monitoring these fluctuations for better urban planning and health policy development [19].
Conversely, the trend in Masjed Soleyman was not statistically significant (P=0.773), indicating a more stable climatic pattern that might be influenced by local topographical features or microclimates that mitigate temperature fluctuations. The significant trends observed in cities like Ahvaz and Safi Abad signal an urgent need for policy interventions. Increasing DTR correlates with greater variability in extreme temperatures, leading to more frequent instances of heat-related illnesses. Sharafkhani et al. examined the association between DTR and mortality in Tabriz, showing that increased DTR was significantly linked to higher mortality rates, particularly among vulnerable groups such as the elderly. This research underscores the health risks posed by temperature fluctuations and suggests that similar risks might be present in Khuzestan’s population due to its high DTR levels [20]. Overall, our analysis indicates that the trend of DTR is increasing across all five cities. These findings highlight the importance of incorporating DTR into health action plans, particularly for preparing for heatwaves and other climate-related health risks [21, 22]. This study also aligns with global analyses indicating a general increase in DTR since the 1980s, with variations across different continents [23, 24]. In Europe and Asia, significant increases in DTR have been attributed to greater warming of maximum temperatures compared to minimum temperatures. This trend suggests that urbanization and land use changes may contribute to altering local climate patterns, including DTR [25, 26].
High DTR can lead to increased instances of heat stress, particularly during summer months. When temperatures fluctuate significantly between day and night, it can strain the body’s ability to regulate temperature, leading to conditions, such as heat exhaustion and heat stroke [27]. Research indicates that DTR might serve as an effective indicator of the relationship between temperature variations and mortality. Temperature fluctuations have significant health-related consequences. Recent studies show a strong association between severe changes in DTR and mortality related to cardiovascular and respiratory diseases [28]. Aghababaeian et al. investigated the impact of DTR on hospital admissions due to cardiovascular and respiratory diseases in Dezful, another city in Khuzestan Province. Their study revealed that high DTR is strongly associated with increased hospital admissions, particularly during periods of extreme weather. These findings reinforce the critical need for local preventive measures to mitigate the health impacts of DTR in vulnerable regions [17]. Notably, DTR has emerged as a new risk factor for sudden infant death syndrome (SIDS) [29]. Furthermore, extreme DTR variations can result in increased heart rate, elevated blood pressure, and a heightened risk of cardiovascular issues [10]. Elevated DTR, particularly when coupled with high humidity, may also raise the incidence of influenza [30]. Elevated temperatures associated with high DTR can worsen air quality, particularly increasing levels of ground-level ozone [31]. This deterioration can lead to respiratory problems and increased hospital admissions.
Factors, such as gender, age, and season, may influence the impact of DTR on health [10]. The elderly and children are more vulnerable to the effects of DTR [10]. Moreover, socio-economic and educational status can influence how DTR impacts health outcomes. Research shows that individuals aged 75 and older are at a significantly higher risk of mortality associated with DTR [32]. Increased DTR could also lead to a rise in certain viral infections, particularly among children [33]. Implementing preventive programs targeting high-risk subgroups, such as the elderly, may mitigate the health impacts of significant temperature changes [34]. Extreme temperature variations can also impact mental health. Studies have shown that increased DTR correlates with higher rates of mental health issues, including anxiety and depression [35]. The stress of coping with extreme temperatures can lead to increased psychological distress, particularly in populations already facing socio-economic challenges [36].
Fluctuations in temperature can influence the transmission dynamics of infectious diseases. For instance, certain pathogens thrive in specific temperature ranges, and significant changes in DTR can alter the prevalence and spread of diseases like malaria and dengue fever, further complicating public health responses [37, 38].
The established role of DTR as an independent risk factor for mortality, alongside other meteorological indicators, highlights the need for continued research and the development of informed public health policies [8, 39]. Localized studies are essential for understanding regional climate dynamics and informing public health policies that prioritize community resilience [40]. Given the limited studies conducted in Iran and considering that Khuzestan is one of the provinces with high average temperatures and potentially significant impacts from climate change, examining the DTR trend is crucial. Due to the limited number of collected data in some years, we considered only those years in which 90% of the meteorological data were recorded. The trend of increasing DTR observed in all five cities suggests that future studies could explore the relationship between DTR trends and mortality rates, as well as emergency department admissions in these cities. Further research is needed to understand the adverse effects of DTR in different geographic locations. It is recommended that preventive measures be implemented to protect vulnerable populations from the severe adverse effects of DTR.
Conclusion
The trend of DTR has shown an increase across all five cities in Khuzestan, highlighting potential implications for public health in the region. This increasing trend suggests a growing need to assess its direct and indirect impacts on health, particularly among vulnerable populations, such as the elderly, children, and individuals with pre-existing conditions. Future studies may explore the relationship between this trend and mortality rates, as well as its impact on public health in these cities. Additionally, investigating the role of other contributing factors, such as urbanization and land use changes, in shaping DTR trends could provide a more comprehensive understanding. The DTR is a globally suitable indicator for reflecting climatic changes and their health implications. Examining the DTR trend in Khuzestan is particularly important due to its high average temperatures and extreme climatic conditions, which may be significantly affected by climate change. Policymakers should prioritize integrating DTR monitoring into regional and national health strategies. Long-term intervention policies, such as incorporating DTR into future health action plans, especially among vulnerable communities, could help mitigate the adverse health effects of DTR. Public awareness campaigns and adaptive measures should also be implemented to enhance community resilience to temperature fluctuations. As a researcher, several policy and executive suggestions are proposed based on the study findings. First, establishing a DTR monitoring system is essential. This involves developing a comprehensive and continuous monitoring network across Khuzestan to assess trends and identify high-risk areas. Additionally, incorporating DTR-related risks into regional and national health policies is crucial, particularly with a focus on vulnerable groups such as the elderly and individuals with chronic diseases. Urban planning adjustments also play a significant role in mitigating the effects of temperature fluctuations. Encouraging green infrastructure and sustainable urban design can help reduce the adverse impacts of extreme DTR, especially in densely populated areas. Public education campaigns should be initiated to raise awareness about the potential health risks associated with extreme DTR fluctuations and to promote adaptive behaviors at the community level. Lastly, strengthening collaboration between health, environmental, and meteorological agencies is vital. Such partnerships can facilitate the development of integrated strategies to reduce climate-related health risks and enhance resilience in affected regions. This study may contribute to better targeting of vulnerable populations and the development of effective strategies. Ultimately, these efforts could support evidence-based policymaking aimed at minimizing the health risks associated with changing climatic conditions in Khuzestan and similar regions globally.
Ethical Considerations
Compliance with ethical guidelines
This study was approved by the Tehran University of Medical Sciences, Tehran, Iran (Code: IR.TUMS.SPH.REC.1402.221).
Funding
This study was funded by the Center for Air Pollution Research (CAPR), Institute for Environmental Research (IER), Tehran University of Medical Sciences, Tehran, Iran (Project No.: 1402-3-462-65769).
Authors' contributions
Study design and writing the original draft: Masoumeh Gharaee and Mostafa Hadei; Data analysis: Mostafa Hadei, Masoumeh Gharaee and Hossein Zeraati; Review and editing: Hossein Zeraati, Abbas Sadeghi, and Samira Karimi; Supervision: Masoumeh Gharaee and Mostafa Hadei; Funding: Mostafa Hadei; Data collection and final approval: All authors.
Conflict of interest
The authors declared no conflict of interests.
Acknowledgments
The authors wish to thank the Center for Air Pollution Research (CAPR), Institute for Environmental Research (IER), Tehran University of Medical Sciences, Tehran, Iran, for financial support of this study.
References
Full-Text: (665 Views)
Introduction
Over the past 50 years, climate change has been increasingly evident and significant [1]. These changes include rising temperatures, decreasing precipitation, humidity fluctuations, etc. One meteorological index closely linked to temperature variations is the diurnal temperature range (DTR) [2, 3]. This index is calculated by the difference between the maximum and minimum temperatures within a day, reflecting the degree of temperature fluctuation or stability over a 24-hour period [1]. Temperature variations can have various consequences, with health impacts being particularly crucial. In recent decades, the effects of climate change on human health have emerged as one of the most pressing global concerns. Climate change encompasses rising average global temperatures, shifting precipitation patterns, and increasing frequency and intensity of extreme weather events [4]. These changes directly and indirectly affect human health [5]. Direct effects include increased mortality from heat-related illnesses and cardiovascular diseases due to higher temperatures and heat waves [6-8]. Indirect effects involve impacts on air quality, water resources, and food production, all of which potentially influence both physical and mental health [9].
The DTR is recognized as a significant indicator in climate studies. DTR, representing the difference between the highest and lowest temperatures in a single day, can have various effects on the environment and human health. Studies have shown that extreme fluctuations in DTR can increase the risk of respiratory and cardiovascular diseases and are associated with higher mortality rates. These impacts are particularly pronounced in regions with extreme or unstable climatic conditions [10]. Globally, the impact of DTR on human health has been extensively studied. Research across different regions has demonstrated that severe changes in DTR correlate with increased mortality rates, especially among vulnerable groups, such as the elderly and individuals with chronic illnesses. These studies underscore the importance of understanding and predicting DTR patterns to mitigate its adverse effects on communities [10, 11]. Recent studies have also established a link between DTR and hospital admissions for cardiovascular and respiratory diseases, particularly in elderly populations (over 65 years), one of the most vulnerable groups in society [12-14]. Lee et al., in a study conducted in several countries also explored the risk of daily mortality associated with DTR [15]. Although numerous studies have examined the relationship between DTR and its various health impacts globally, most of this research has been conducted in Southeast Asia.
Khuzestan Province, located in southwestern Iran, offers a unique context for studying the effects of climate on health due to its geographical location and specific climatic conditions. Khuzestan experiences extremely hot and dry summers and mild winters, which can significantly impact the health of its residents [16]. For instance, the intense summer heat can increase the risk of heat-related mortality and other heat-associated diseases. However, despite the distinct climatic conditions in Khuzestan, limited research has been conducted on the effects of DTR on health in this region. Some studies in other parts of Iran have explored the relationship between temperature and mortality, but there are few studies specifically focused on DTR and its health impacts in Khuzestan [17]. Moreover, with climate change expected to exacerbate extreme heat events, understanding the variations in DTR and its long-term trends becomes even more urgent for public health planning. Additionally, there has been little research on the changes in this index over the past decades in Khuzestan Province. Given the increasing importance of this issue, the limited studies conducted in Iran, and the fact that Khuzestan is among the provinces with the highest average temperatures and likely to be most affected by climate change, this study becomes crucial in providing a comprehensive analysis of the trend of DTR over time. Understanding these changes can help in predicting future health risks associated with climate change, enabling better preparedness and mitigation strategies. The present study aimed to examine the changes in the DTR across five cities in Khuzestan Province over the three decades from 1990 to 2022.
Materials and Methods
Study design
This study employed a quantitative descriptive approach to analyze meteorological data, specifically focusing on temperature-related variables. The meteorological data used in this study were collected from five cities in Khuzestan Province. Khuzestan is classified as part of Iran’s hot and dry climate regions, making it a relevant area for studying temperature-related climatic changes. The meteorological variables included maximum temperature (Tmax) and minimum temperature (Tmin) for the cities of Masjed Soleyman, Abadan, Aghajari, Ahvaz, and Safi Abad from 1990 to 2022. These cities were selected because they are the only ones in Khuzestan Province with operational meteorological stations providing long-term and reliable data for the study period.
Data source and validation
The meteorological data were obtained from the Global Summary of the Day (GSOD) database, ensuring accuracy and ethical sourcing of the data. All data were sourced and used ethically, adhering to the guidelines of proper data utilization. Initially, due to the limited number of data points in some years, only those years were considered where 90% of the meteorological data were recorded. The completeness percentage of meteorological data was examined by year from 1990 to 2022, and the years with more than 90% of meteorological data were identified and included in the study.
DTR calculation
The DTR was calculated as the difference between Tmax and Tmin for each day. For each city, annual averages of Tmax, Tmin, and DTR were computed by aggregating daily data. These annual averages provided insights into long-term temperature trends and variability.
Linear regression analysis
To quantify the long-term trend of DTR in each city, linear regression models were fitted to the annual averages of DTR as a function of time (year). The regression equation was used to estimate the rate of change in DTR over the study period. Adjusted R2 values were calculated to assess the explanatory power of the models, while P were computed to evaluate the statistical significance (at a level of 0.05) of the trends.
Seasonal decomposition analysis
Seasonal decomposition analysis was employed to decompose the daily DTR time series for each city into three primary components: Trend, seasonal, and residual, using an additive model. This technique is integral for isolating the underlying long-term trends, capturing the repetitive seasonal patterns, and identifying irregular or stochastic variations within the dataset. The decomposition was performed using Python programming, specifying a seasonal period of 365 days to account for annual cyclicality.
Trend component: The trend component was extracted to represent the smoothed progression of DTR over the study period, highlighting long-term shifts potentially influenced by climatic changes or urbanization effects. It was calculated by applying a centered moving average over the specified seasonal period, smoothing out short-term fluctuations to reveal macro-level changes in the DTR.
Seasonal component: The seasonal component isolated the recurring intra-annual patterns in DTR, reflecting consistent variations across seasons (e.g. higher DTR in summer and lower DTR in winter). This component allowed for the quantification and visualization of the cyclical contributions of seasonal climatic factors to temperature variability.
Residual component: The residual (or irregular) component represented the remaining variability after removing the trend and seasonal components. This included random fluctuations, extreme weather events, or any unexplained variance in the DTR. The residuals were inspected to identify potential anomalies, such as spikes that may correlate with specific meteorological phenomena.
To address the issue of missing data, linear interpolation was applied to the DTR time series prior to decomposition. This ensured continuity in the analysis and minimized the distortion of results while retaining the integrity of the original data.
The decomposition results were visualized as a four-panel plot for each city, displaying the observed DTR series along with the extracted trend, seasonal, and residual components. The seasonal decomposition facilitated a detailed understanding of the temporal dynamics of DTR, enabling the distinction between deterministic seasonal effects and non-deterministic irregularities. This approach provided critical insights into the temporal evolution of DTR and its underlying drivers, particularly in the context of regional climatic variability in Khuzestan Province.
This methodologically rigorous decomposition supported the identification of trends that were subsequently validated through statistical modeling, ensuring robust interpretations of DTR patterns across all five cities.
Statistical software
All analyses were performed in Python software, version 3.11.4. The following libraries were applied: Pandas (version 2.0.3) for data manipulation, Matplotlib (version 3.7.2) for visualization, and Statsmodels (version 0.14.0) together with Scikit-learn (version 1.3.0) for statistical modeling and regression analysis.
Results
For the cities of Masjed Soleyman, Abadan, Aghajari, Ahvaz, and Safi Abad, the DTR was calculated for the years where 90% of the meteorological data were recorded by subtracting the Tmin from the Tmax. The scatter plot showing the trend of DTR for each city is presented below. According to the calculations, the DTR trend in all five cities showed an increase.
Yearly averages of Tmin, Tmax, and DTR
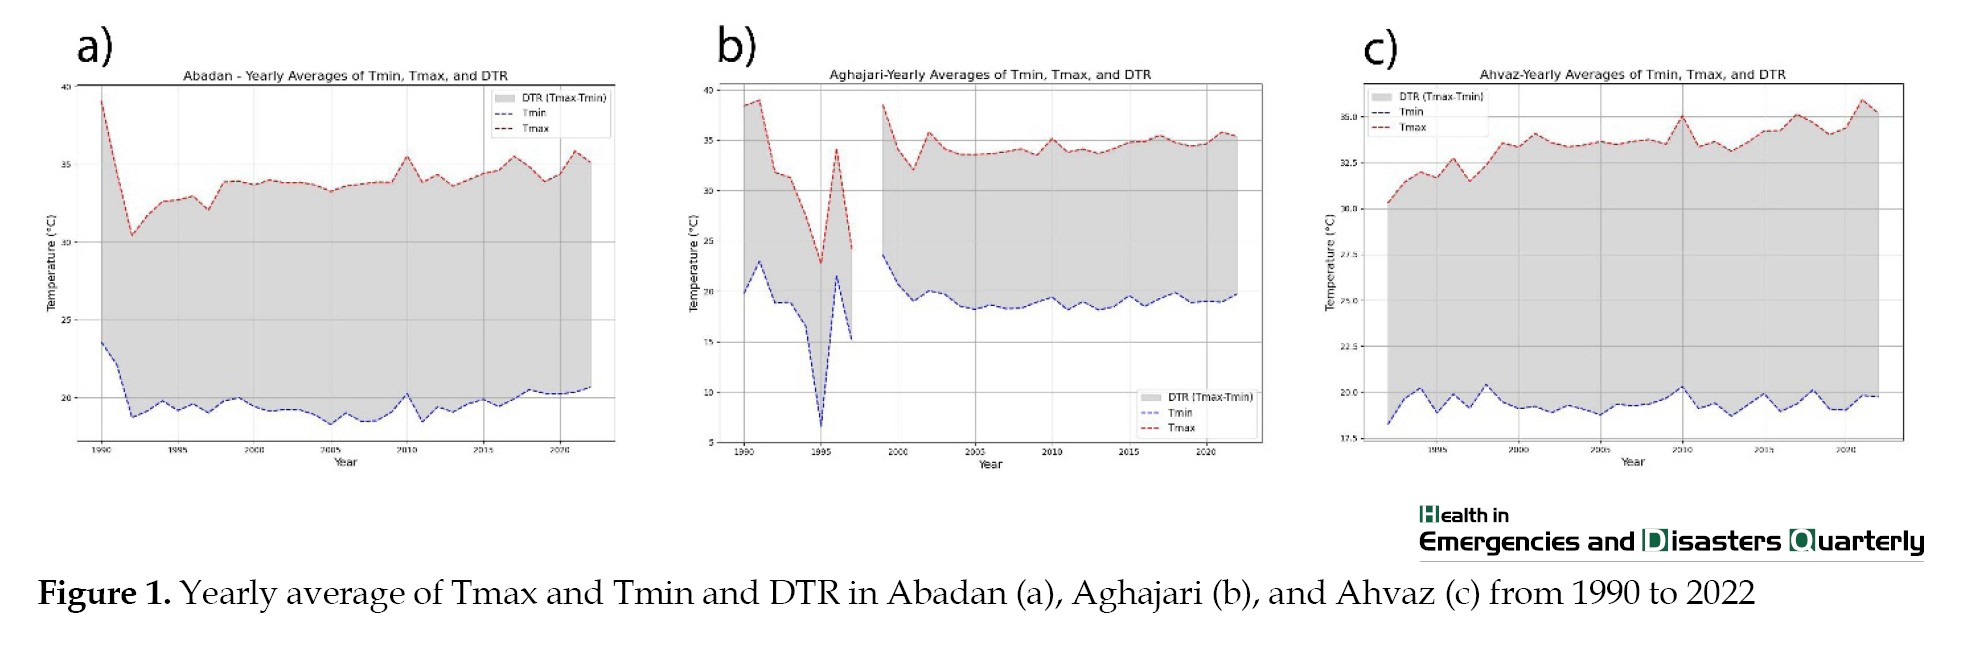
The meteorological trends in Abadan between 1995 and 2022 reveal important insights into temperature dynamics and the DTR. Approximately 90% of meteorological indicators for this city have been recorded during this period. The median DTR from 1995 to 2020 ranged between 23.8 and 28.5 °C, while the maximum DTR fluctuated between 39.2 and 47.9 °C. Analysis of the yearly averages of Tmin) and Tmax, along with the derived DTR (Tmax-Tmin), highlights key patterns over the years. Tmax values consistently exceed Tmin, showing a notable peak in the early 1990s, followed by stabilization and a slight upward trend after 2000. Tmin values follow a similar trajectory but exhibit less pronounced fluctuations. The shaded region representing the DTR indicates relatively stable values throughout the years, with only minor fluctuations.
The yearly averages of Tmin, Tmax, and DTR in Aghajari reveal distinct patterns over the years. The shaded region representing the DTR (Tmax-Tmin) shows variability but remains relatively consistent in amplitude. Tmax values, shown with a red dashed line, exhibit a high peak in the early 1990s, followed by a sharp drop and stabilization around 2000. Similarly, Tmin values, depicted with a blue dashed line, follow a similar trajectory, with a notable decrease in the early 1990s and steady values thereafter. These patterns indicate significant climatic shifts in the early years, followed by stabilization in temperature dynamics. From 2004 to 2022, 90% of meteorological indicators in Aghajari were recorded. During this period, the median DTR ranged from 27.4 to 30.6 °C, with the highest median observed in 2021. The maximum DTR fluctuated between 41 and 47.1 °C.
The yearly averages of Tmin, Tmax, and DTR in Ahvaz reveal clear temperature trends over the analyzed years. Tmax values, shown with a red dashed line, exhibit a gradual increase with minor fluctuations, indicating an overall upward trend. Similarly, Tmin values, depicted with a blue dashed line, show a more subtle but consistent rise over the same period. The shaded region representing the DTR remains relatively consistent, though a slight narrowing in recent years suggests reduced variability between daytime and nighttime temperatures. These patterns reflect the warming climate of Ahvaz, with both Tmin and Tmax steadily increasing. Between 1992 and 2022, 90% of meteorological indices in Ahvaz were recorded. During this period, the maximum DTR fluctuated between 19.11 and 39.61 °C. The trend of the DTR index in Ahvaz has been increasing, with 45% of the changes in DTR influenced by time (Figure 1).
Over the past 50 years, climate change has been increasingly evident and significant [1]. These changes include rising temperatures, decreasing precipitation, humidity fluctuations, etc. One meteorological index closely linked to temperature variations is the diurnal temperature range (DTR) [2, 3]. This index is calculated by the difference between the maximum and minimum temperatures within a day, reflecting the degree of temperature fluctuation or stability over a 24-hour period [1]. Temperature variations can have various consequences, with health impacts being particularly crucial. In recent decades, the effects of climate change on human health have emerged as one of the most pressing global concerns. Climate change encompasses rising average global temperatures, shifting precipitation patterns, and increasing frequency and intensity of extreme weather events [4]. These changes directly and indirectly affect human health [5]. Direct effects include increased mortality from heat-related illnesses and cardiovascular diseases due to higher temperatures and heat waves [6-8]. Indirect effects involve impacts on air quality, water resources, and food production, all of which potentially influence both physical and mental health [9].
The DTR is recognized as a significant indicator in climate studies. DTR, representing the difference between the highest and lowest temperatures in a single day, can have various effects on the environment and human health. Studies have shown that extreme fluctuations in DTR can increase the risk of respiratory and cardiovascular diseases and are associated with higher mortality rates. These impacts are particularly pronounced in regions with extreme or unstable climatic conditions [10]. Globally, the impact of DTR on human health has been extensively studied. Research across different regions has demonstrated that severe changes in DTR correlate with increased mortality rates, especially among vulnerable groups, such as the elderly and individuals with chronic illnesses. These studies underscore the importance of understanding and predicting DTR patterns to mitigate its adverse effects on communities [10, 11]. Recent studies have also established a link between DTR and hospital admissions for cardiovascular and respiratory diseases, particularly in elderly populations (over 65 years), one of the most vulnerable groups in society [12-14]. Lee et al., in a study conducted in several countries also explored the risk of daily mortality associated with DTR [15]. Although numerous studies have examined the relationship between DTR and its various health impacts globally, most of this research has been conducted in Southeast Asia.
Khuzestan Province, located in southwestern Iran, offers a unique context for studying the effects of climate on health due to its geographical location and specific climatic conditions. Khuzestan experiences extremely hot and dry summers and mild winters, which can significantly impact the health of its residents [16]. For instance, the intense summer heat can increase the risk of heat-related mortality and other heat-associated diseases. However, despite the distinct climatic conditions in Khuzestan, limited research has been conducted on the effects of DTR on health in this region. Some studies in other parts of Iran have explored the relationship between temperature and mortality, but there are few studies specifically focused on DTR and its health impacts in Khuzestan [17]. Moreover, with climate change expected to exacerbate extreme heat events, understanding the variations in DTR and its long-term trends becomes even more urgent for public health planning. Additionally, there has been little research on the changes in this index over the past decades in Khuzestan Province. Given the increasing importance of this issue, the limited studies conducted in Iran, and the fact that Khuzestan is among the provinces with the highest average temperatures and likely to be most affected by climate change, this study becomes crucial in providing a comprehensive analysis of the trend of DTR over time. Understanding these changes can help in predicting future health risks associated with climate change, enabling better preparedness and mitigation strategies. The present study aimed to examine the changes in the DTR across five cities in Khuzestan Province over the three decades from 1990 to 2022.
Materials and Methods
Study design
This study employed a quantitative descriptive approach to analyze meteorological data, specifically focusing on temperature-related variables. The meteorological data used in this study were collected from five cities in Khuzestan Province. Khuzestan is classified as part of Iran’s hot and dry climate regions, making it a relevant area for studying temperature-related climatic changes. The meteorological variables included maximum temperature (Tmax) and minimum temperature (Tmin) for the cities of Masjed Soleyman, Abadan, Aghajari, Ahvaz, and Safi Abad from 1990 to 2022. These cities were selected because they are the only ones in Khuzestan Province with operational meteorological stations providing long-term and reliable data for the study period.
Data source and validation
The meteorological data were obtained from the Global Summary of the Day (GSOD) database, ensuring accuracy and ethical sourcing of the data. All data were sourced and used ethically, adhering to the guidelines of proper data utilization. Initially, due to the limited number of data points in some years, only those years were considered where 90% of the meteorological data were recorded. The completeness percentage of meteorological data was examined by year from 1990 to 2022, and the years with more than 90% of meteorological data were identified and included in the study.
DTR calculation
The DTR was calculated as the difference between Tmax and Tmin for each day. For each city, annual averages of Tmax, Tmin, and DTR were computed by aggregating daily data. These annual averages provided insights into long-term temperature trends and variability.
Linear regression analysis
To quantify the long-term trend of DTR in each city, linear regression models were fitted to the annual averages of DTR as a function of time (year). The regression equation was used to estimate the rate of change in DTR over the study period. Adjusted R2 values were calculated to assess the explanatory power of the models, while P were computed to evaluate the statistical significance (at a level of 0.05) of the trends.
Seasonal decomposition analysis
Seasonal decomposition analysis was employed to decompose the daily DTR time series for each city into three primary components: Trend, seasonal, and residual, using an additive model. This technique is integral for isolating the underlying long-term trends, capturing the repetitive seasonal patterns, and identifying irregular or stochastic variations within the dataset. The decomposition was performed using Python programming, specifying a seasonal period of 365 days to account for annual cyclicality.
Trend component: The trend component was extracted to represent the smoothed progression of DTR over the study period, highlighting long-term shifts potentially influenced by climatic changes or urbanization effects. It was calculated by applying a centered moving average over the specified seasonal period, smoothing out short-term fluctuations to reveal macro-level changes in the DTR.
Seasonal component: The seasonal component isolated the recurring intra-annual patterns in DTR, reflecting consistent variations across seasons (e.g. higher DTR in summer and lower DTR in winter). This component allowed for the quantification and visualization of the cyclical contributions of seasonal climatic factors to temperature variability.
Residual component: The residual (or irregular) component represented the remaining variability after removing the trend and seasonal components. This included random fluctuations, extreme weather events, or any unexplained variance in the DTR. The residuals were inspected to identify potential anomalies, such as spikes that may correlate with specific meteorological phenomena.
To address the issue of missing data, linear interpolation was applied to the DTR time series prior to decomposition. This ensured continuity in the analysis and minimized the distortion of results while retaining the integrity of the original data.
The decomposition results were visualized as a four-panel plot for each city, displaying the observed DTR series along with the extracted trend, seasonal, and residual components. The seasonal decomposition facilitated a detailed understanding of the temporal dynamics of DTR, enabling the distinction between deterministic seasonal effects and non-deterministic irregularities. This approach provided critical insights into the temporal evolution of DTR and its underlying drivers, particularly in the context of regional climatic variability in Khuzestan Province.
This methodologically rigorous decomposition supported the identification of trends that were subsequently validated through statistical modeling, ensuring robust interpretations of DTR patterns across all five cities.
Statistical software
All analyses were performed in Python software, version 3.11.4. The following libraries were applied: Pandas (version 2.0.3) for data manipulation, Matplotlib (version 3.7.2) for visualization, and Statsmodels (version 0.14.0) together with Scikit-learn (version 1.3.0) for statistical modeling and regression analysis.
Results
For the cities of Masjed Soleyman, Abadan, Aghajari, Ahvaz, and Safi Abad, the DTR was calculated for the years where 90% of the meteorological data were recorded by subtracting the Tmin from the Tmax. The scatter plot showing the trend of DTR for each city is presented below. According to the calculations, the DTR trend in all five cities showed an increase.
Yearly averages of Tmin, Tmax, and DTR
The meteorological trends in Abadan between 1995 and 2022 reveal important insights into temperature dynamics and the DTR. Approximately 90% of meteorological indicators for this city have been recorded during this period. The median DTR from 1995 to 2020 ranged between 23.8 and 28.5 °C, while the maximum DTR fluctuated between 39.2 and 47.9 °C. Analysis of the yearly averages of Tmin) and Tmax, along with the derived DTR (Tmax-Tmin), highlights key patterns over the years. Tmax values consistently exceed Tmin, showing a notable peak in the early 1990s, followed by stabilization and a slight upward trend after 2000. Tmin values follow a similar trajectory but exhibit less pronounced fluctuations. The shaded region representing the DTR indicates relatively stable values throughout the years, with only minor fluctuations.
The yearly averages of Tmin, Tmax, and DTR in Aghajari reveal distinct patterns over the years. The shaded region representing the DTR (Tmax-Tmin) shows variability but remains relatively consistent in amplitude. Tmax values, shown with a red dashed line, exhibit a high peak in the early 1990s, followed by a sharp drop and stabilization around 2000. Similarly, Tmin values, depicted with a blue dashed line, follow a similar trajectory, with a notable decrease in the early 1990s and steady values thereafter. These patterns indicate significant climatic shifts in the early years, followed by stabilization in temperature dynamics. From 2004 to 2022, 90% of meteorological indicators in Aghajari were recorded. During this period, the median DTR ranged from 27.4 to 30.6 °C, with the highest median observed in 2021. The maximum DTR fluctuated between 41 and 47.1 °C.
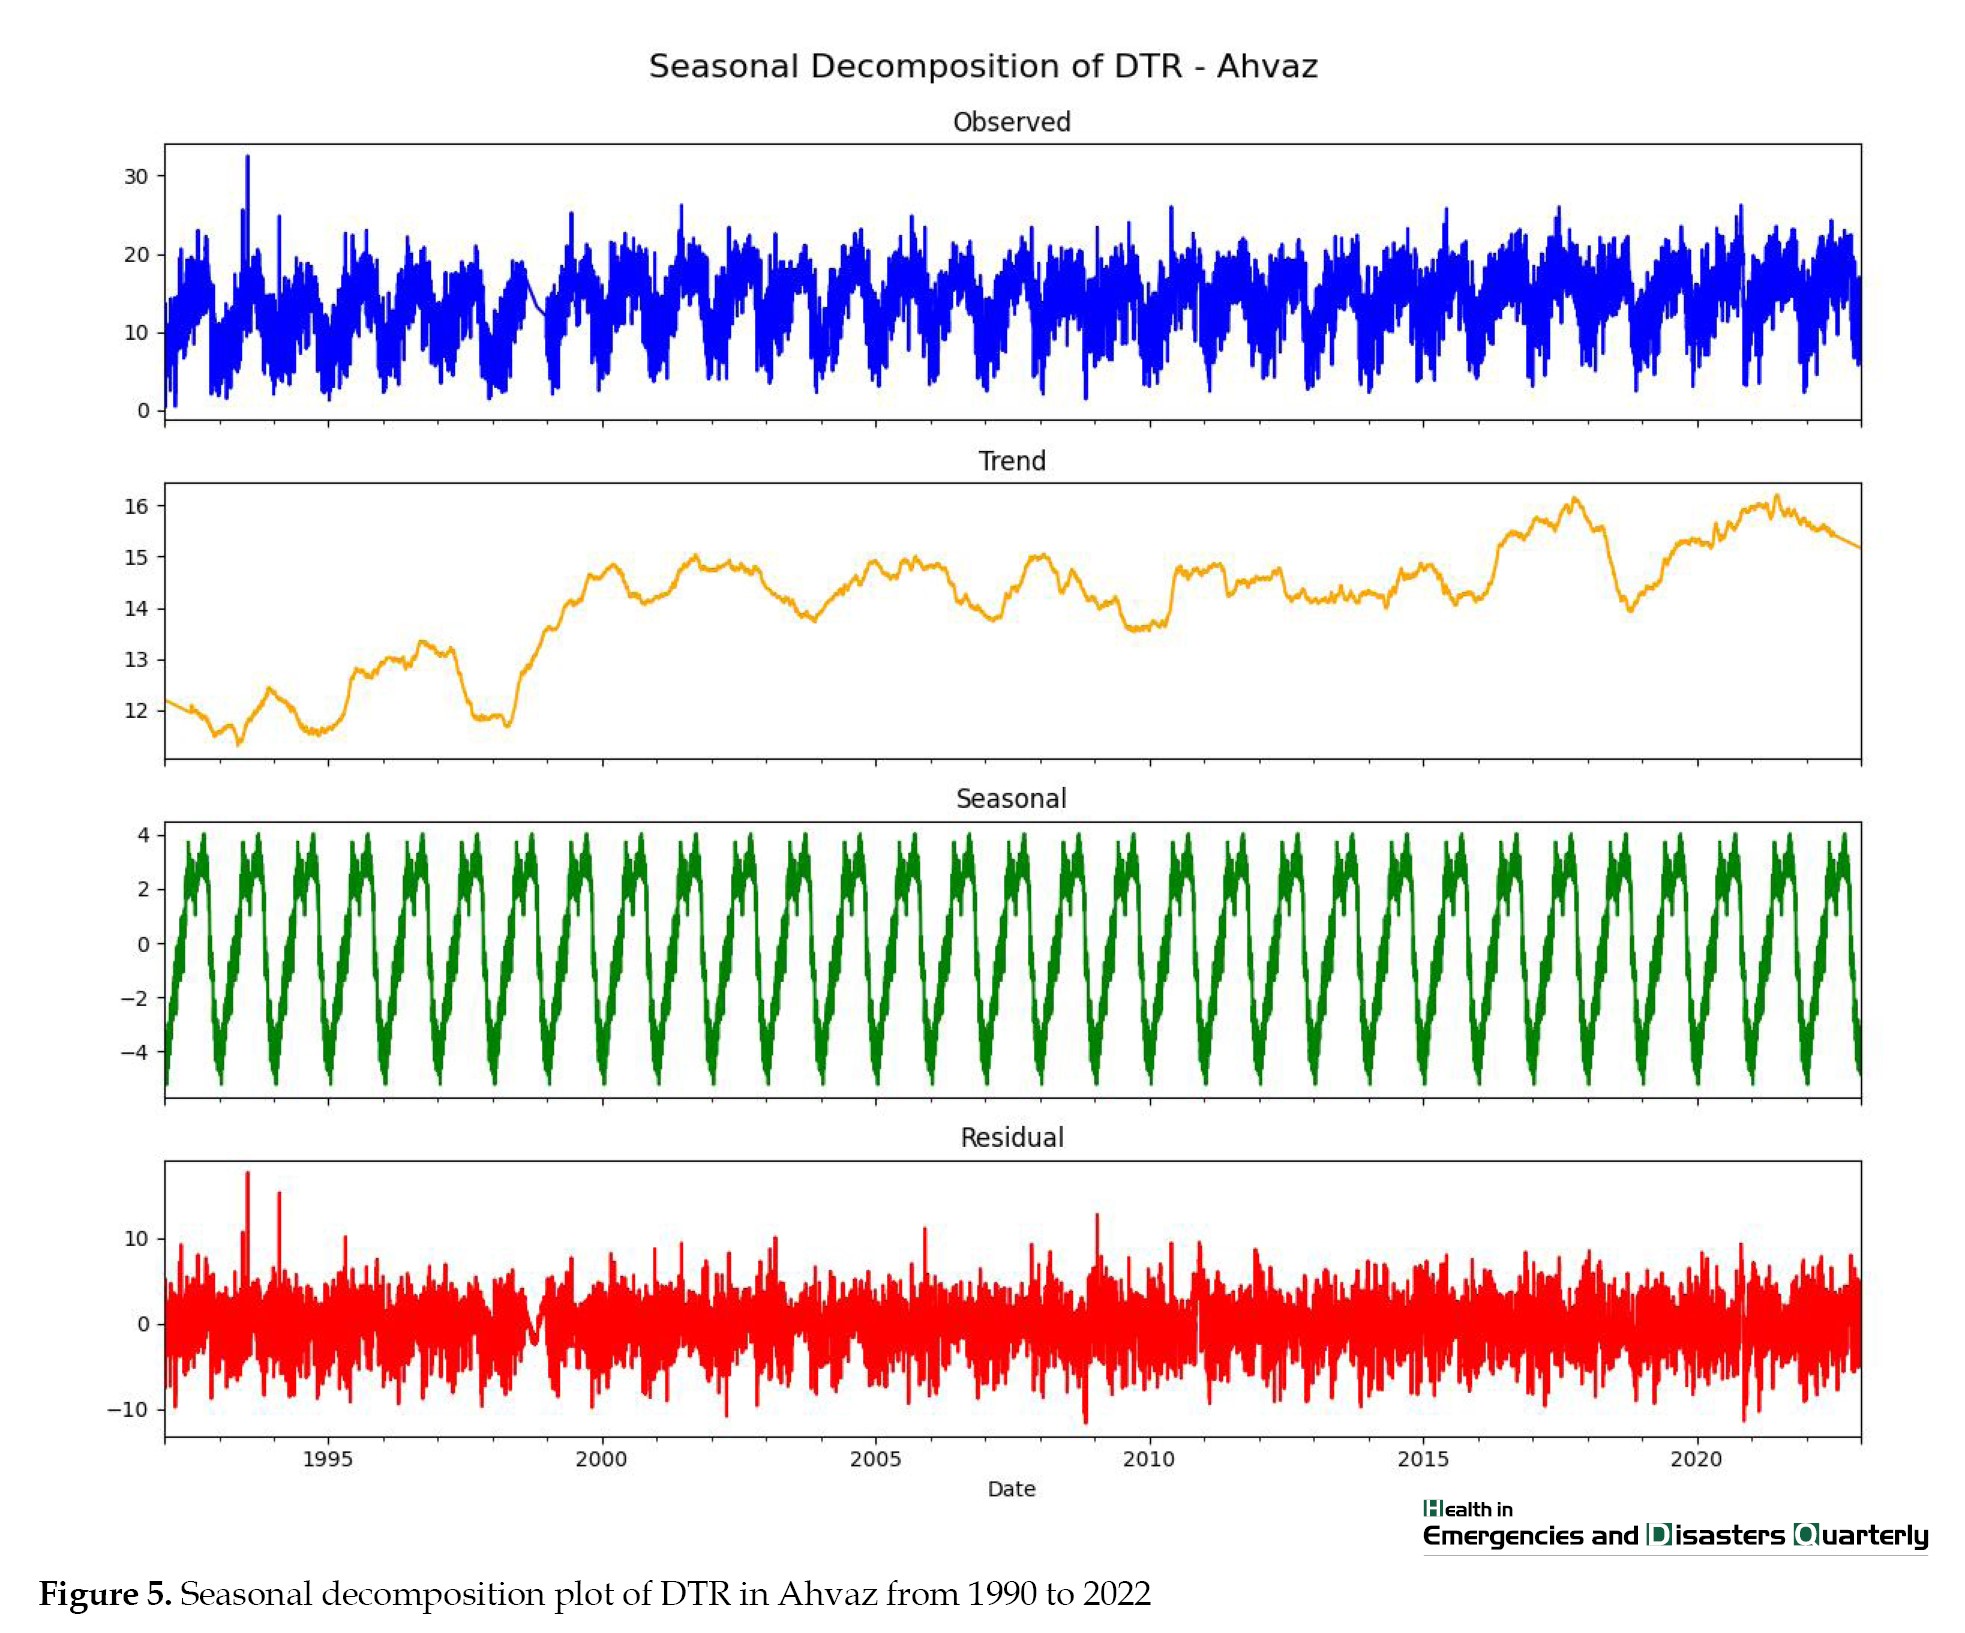
The yearly averages of Tmin, Tmax, and DTR in Ahvaz reveal clear temperature trends over the analyzed years. Tmax values, shown with a red dashed line, exhibit a gradual increase with minor fluctuations, indicating an overall upward trend. Similarly, Tmin values, depicted with a blue dashed line, show a more subtle but consistent rise over the same period. The shaded region representing the DTR remains relatively consistent, though a slight narrowing in recent years suggests reduced variability between daytime and nighttime temperatures. These patterns reflect the warming climate of Ahvaz, with both Tmin and Tmax steadily increasing. Between 1992 and 2022, 90% of meteorological indices in Ahvaz were recorded. During this period, the maximum DTR fluctuated between 19.11 and 39.61 °C. The trend of the DTR index in Ahvaz has been increasing, with 45% of the changes in DTR influenced by time (Figure 1).
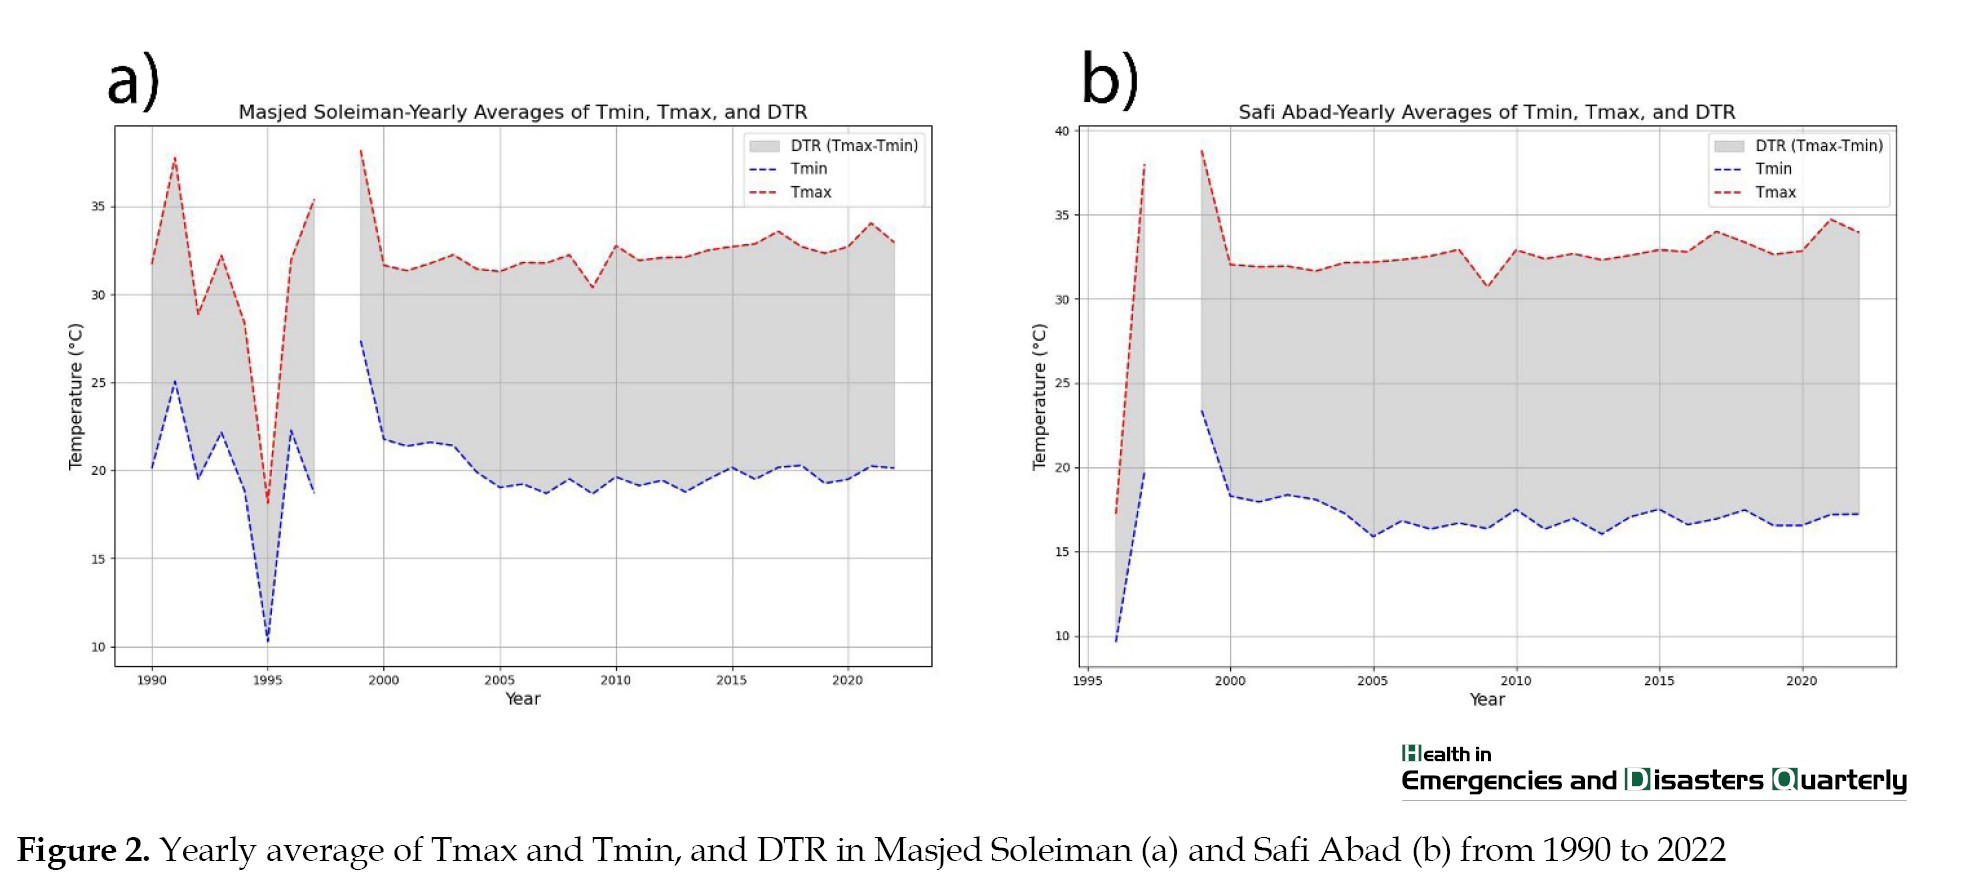
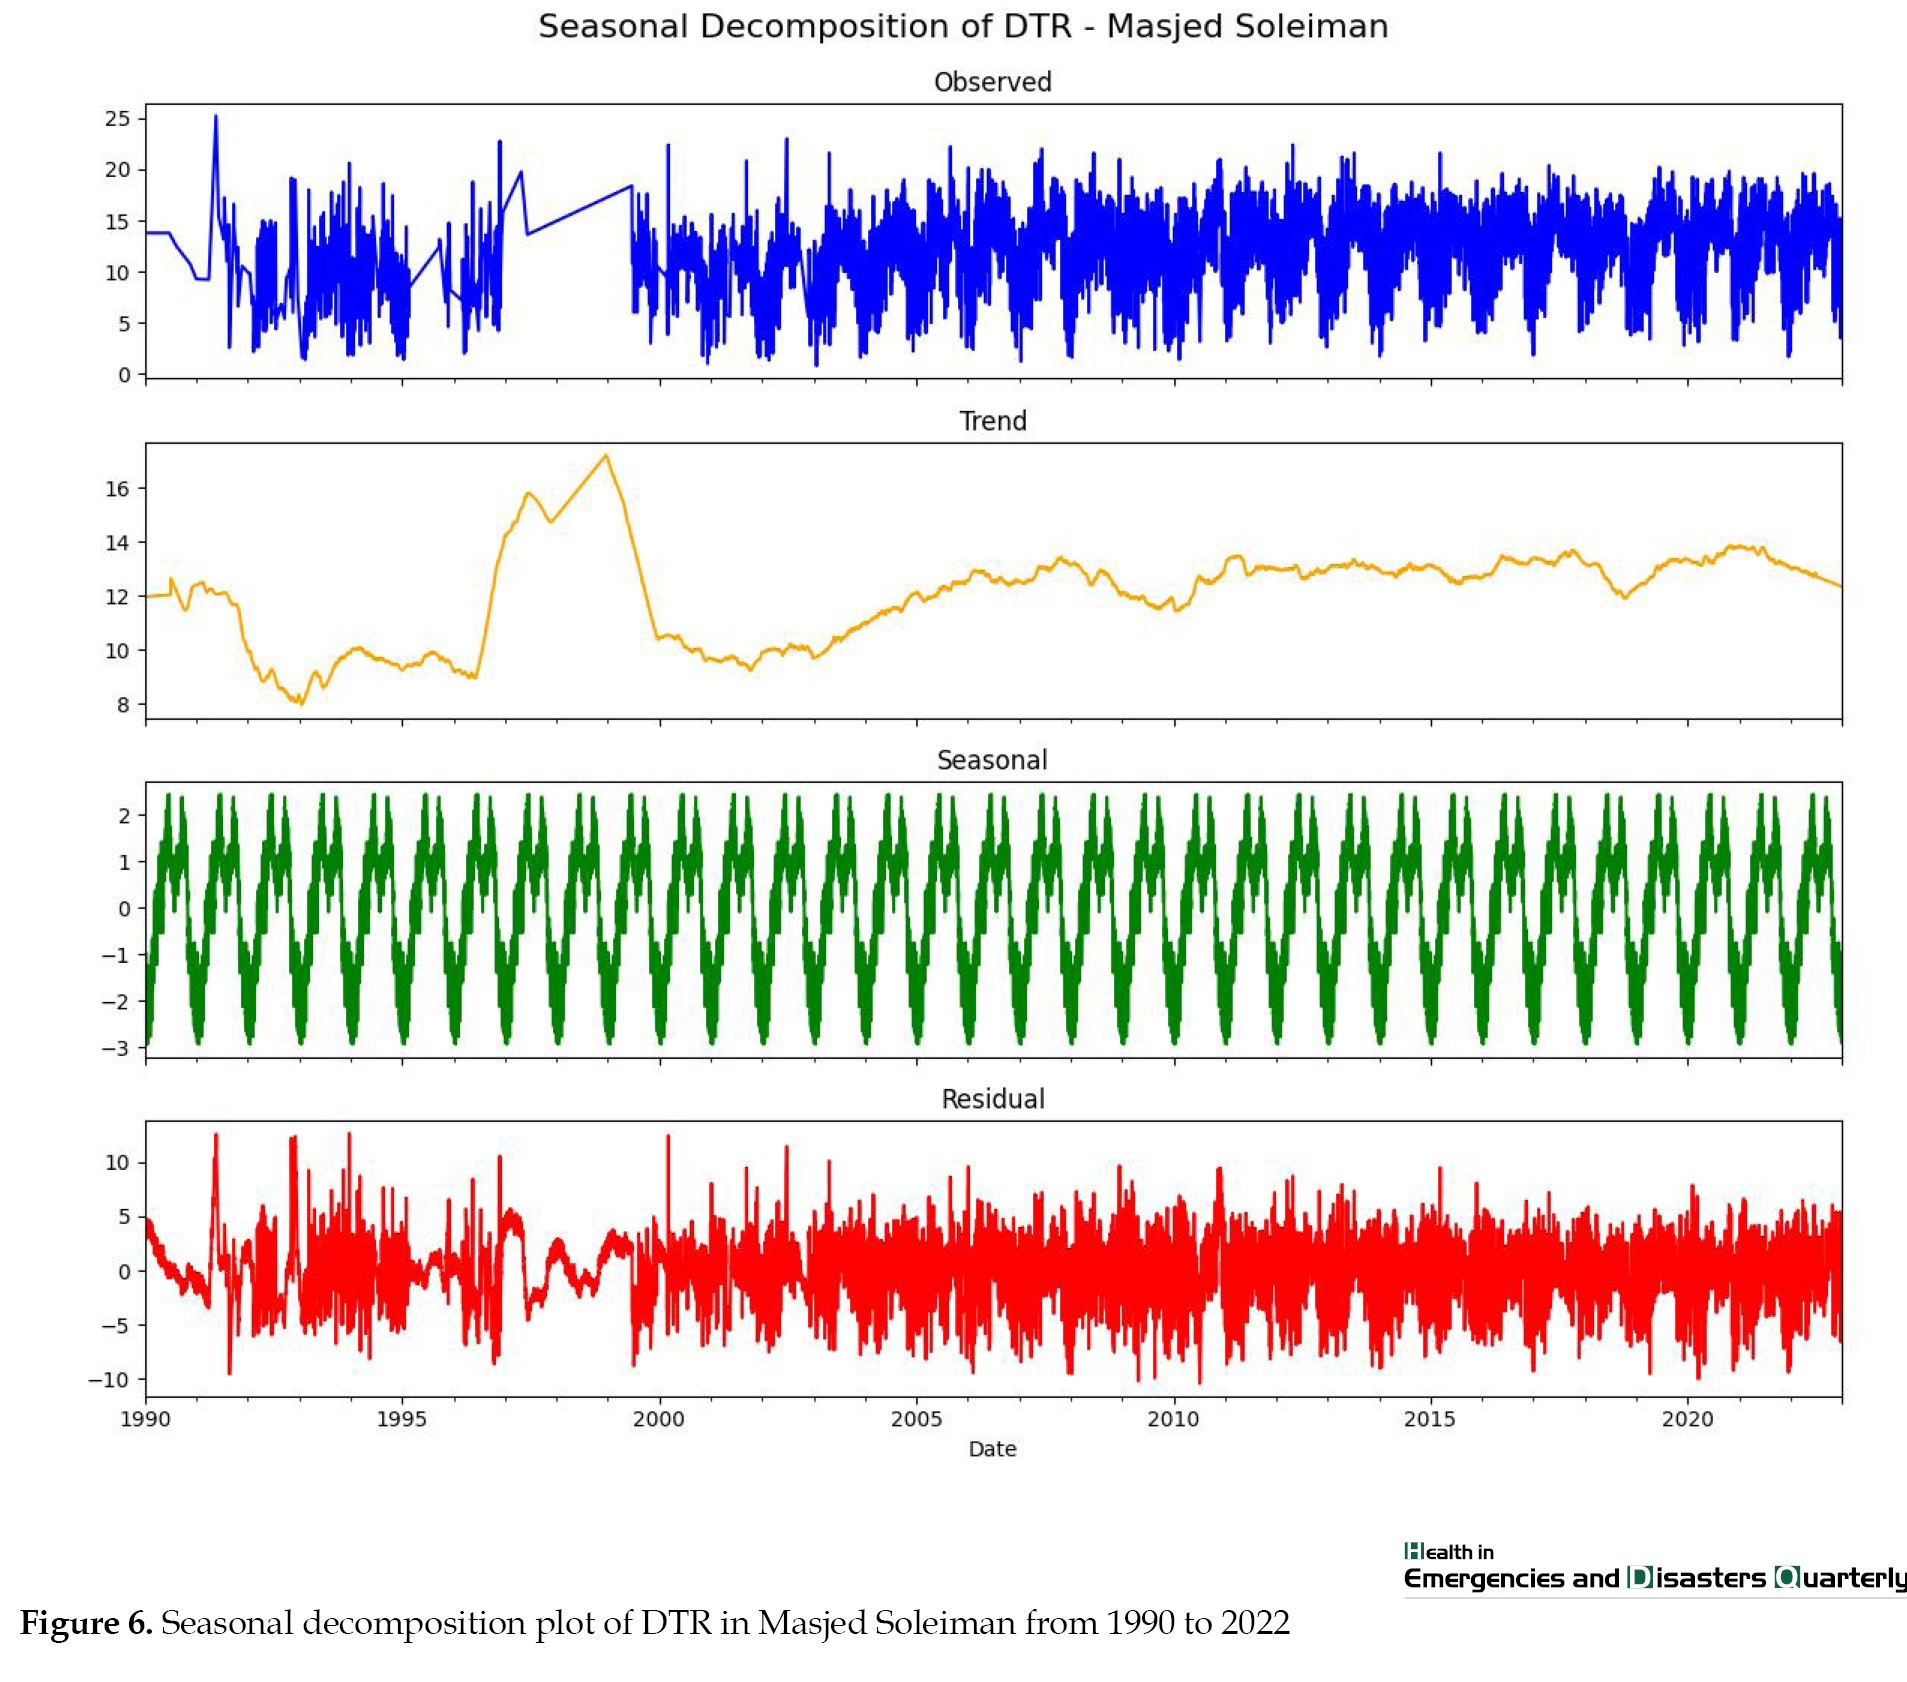
The yearly averages of Tmin, Tmax, and DTR for Masjed Soleiman show noticeable patterns over the study period. The Tmax (red dashed line) initially exhibits significant fluctuations in the early 1990s, followed by stabilization and a slight upward trend post-2000. Similarly, the Tmin (blue dashed line) also shows high variability in the 1990s, with a marked decrease around 1995, stabilizing at lower values post-2000. The shaded area representing the DTR (Tmax-Tmin) narrows slightly over the years, indicating reduced variability between daytime and nighttime temperatures in the latter part of the study period. These trends reflect both the climatic fluctuations in the early years and a more stabilized temperature pattern in the recent years. In Masjed Soleyman, 90% of the meteorological variables were only recorded between 2004 and 2022. In this city, the maximum DTR fluctuated between 38.9 and 46.4 °C between 2004 and 2022 (Figure 2).
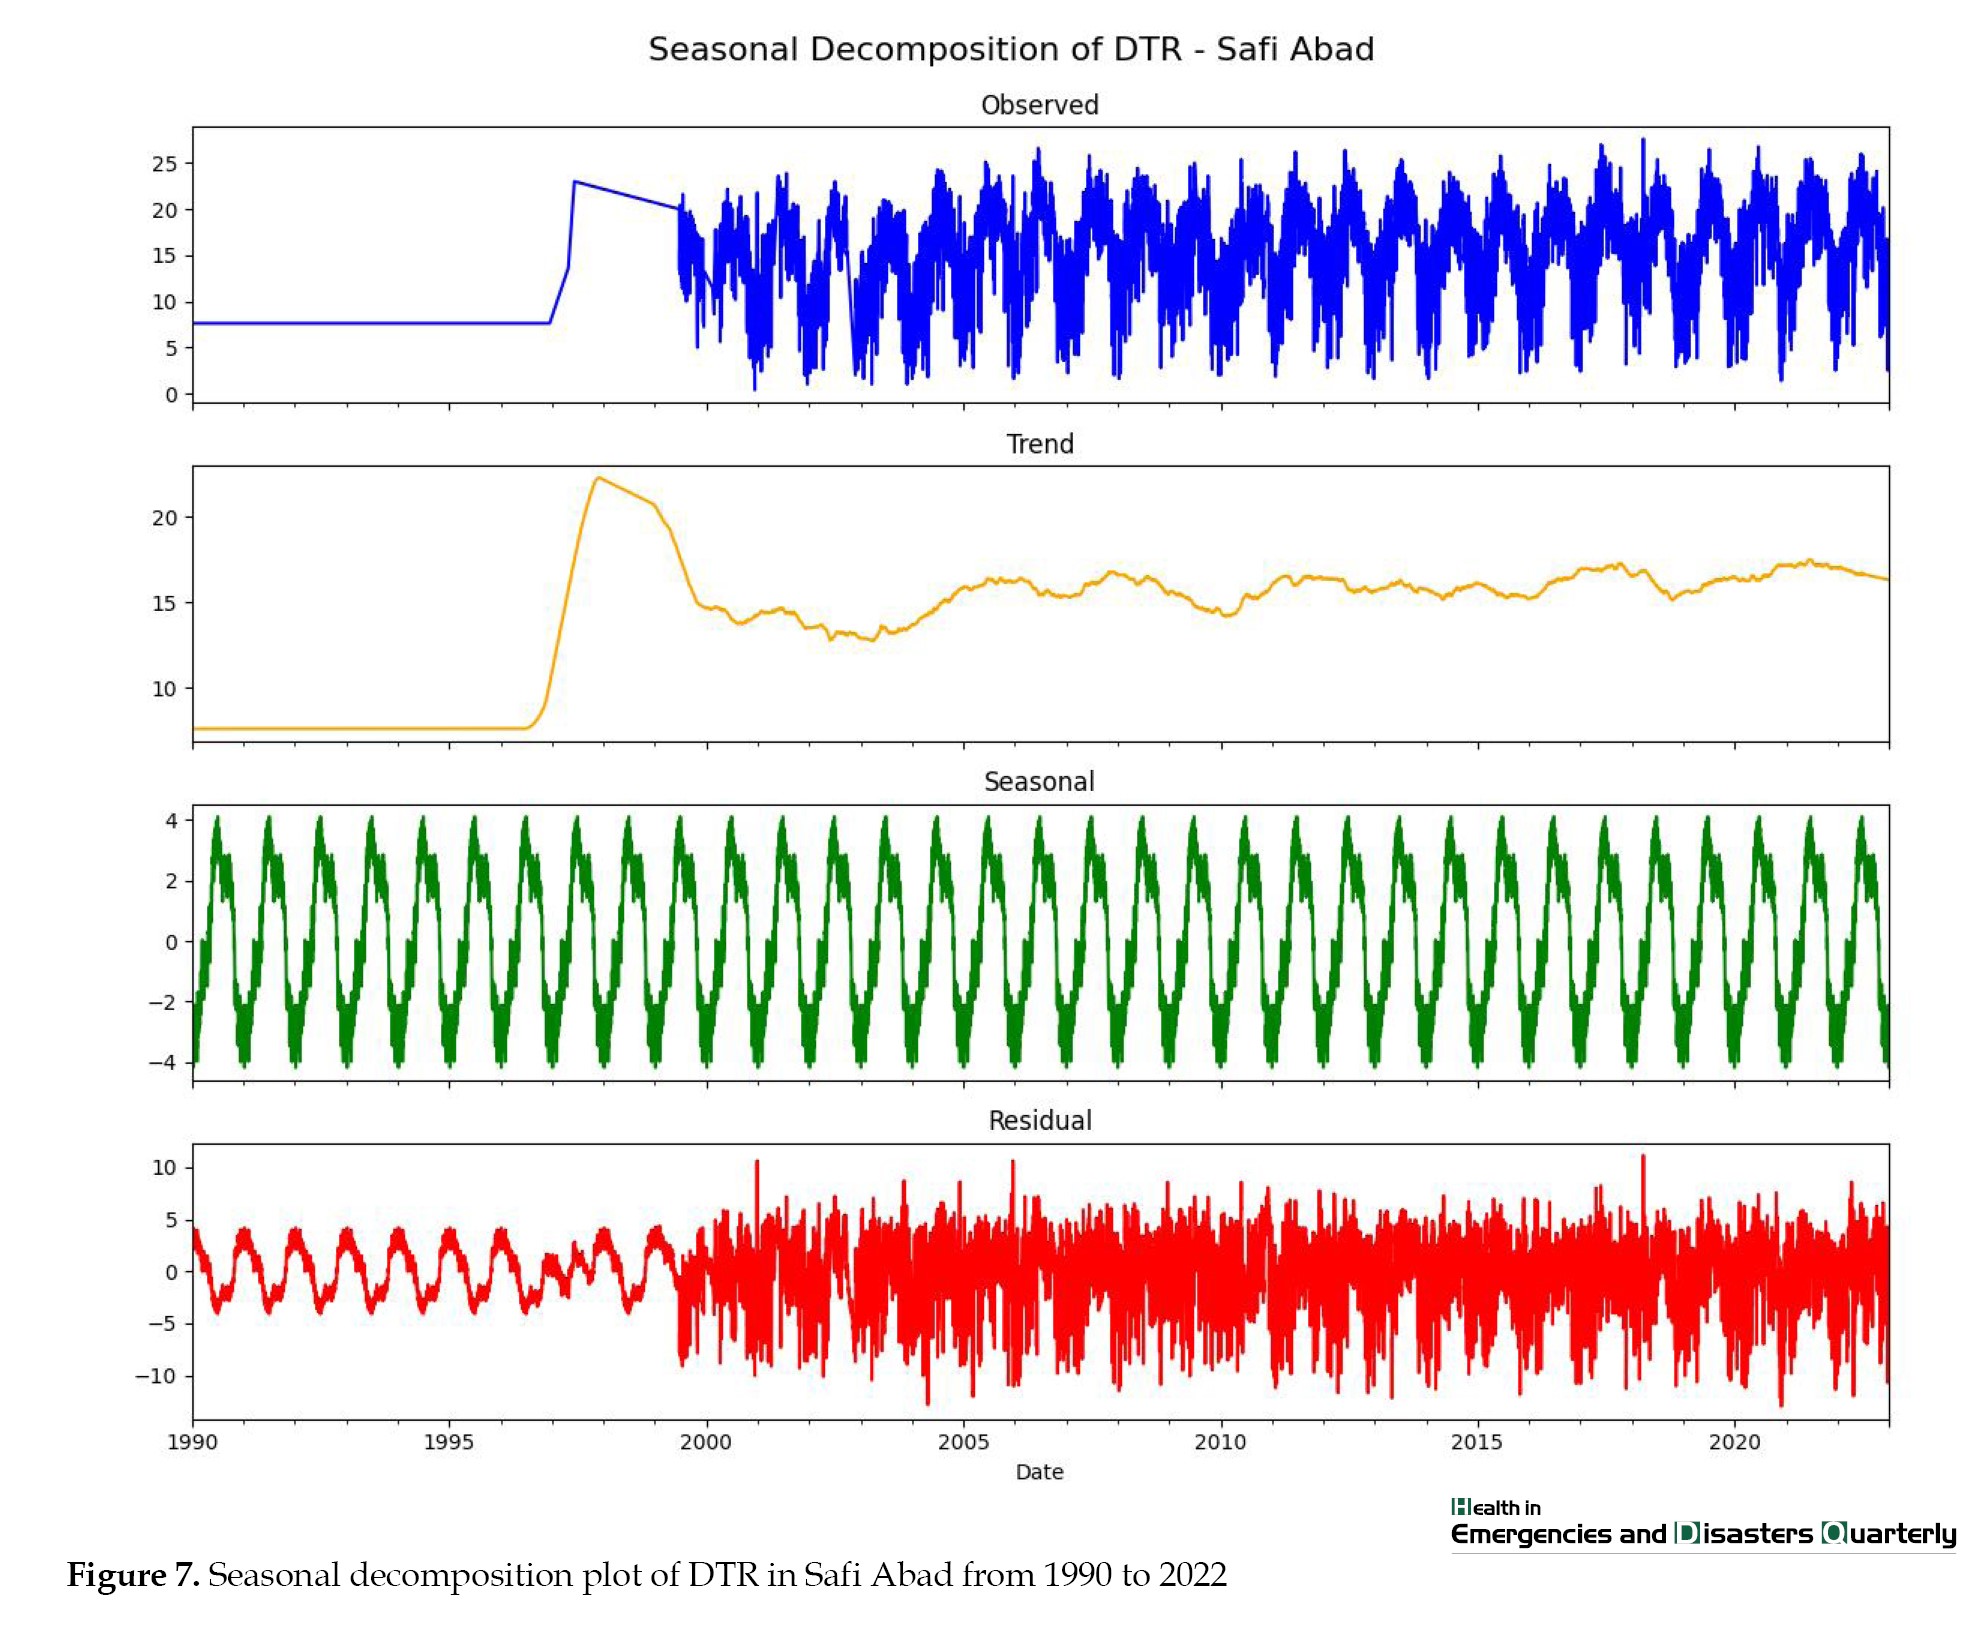
The yearly averages of Tmin, Tmax, and DTR in Safi Abad reveal distinct patterns. The Tmax values (red dashed line) initially display high variability in the early years, followed by stabilization around the year 2000 and slight increases afterward. Similarly, Tmin values (blue dashed line) show sharp initial fluctuations before stabilizing, with minimal variations over the later years. The shaded region representing the DTR (Tmax-Tmin) is consistently maintained, although a slight narrowing of the range is observed in the latter years, reflecting reduced variability between daytime and nighttime temperatures. These patterns indicate a shift from climatic instability in the earlier years to more stable temperature dynamics in recent decades. In Safi Abad, 90% of meteorological indicators have been recorded between 2005 and 2022. During this period, the maximum DTR in Safi Abad fluctuated between 43.2 and 49.7 °C (Figure 2).
Linear regression results for DTR
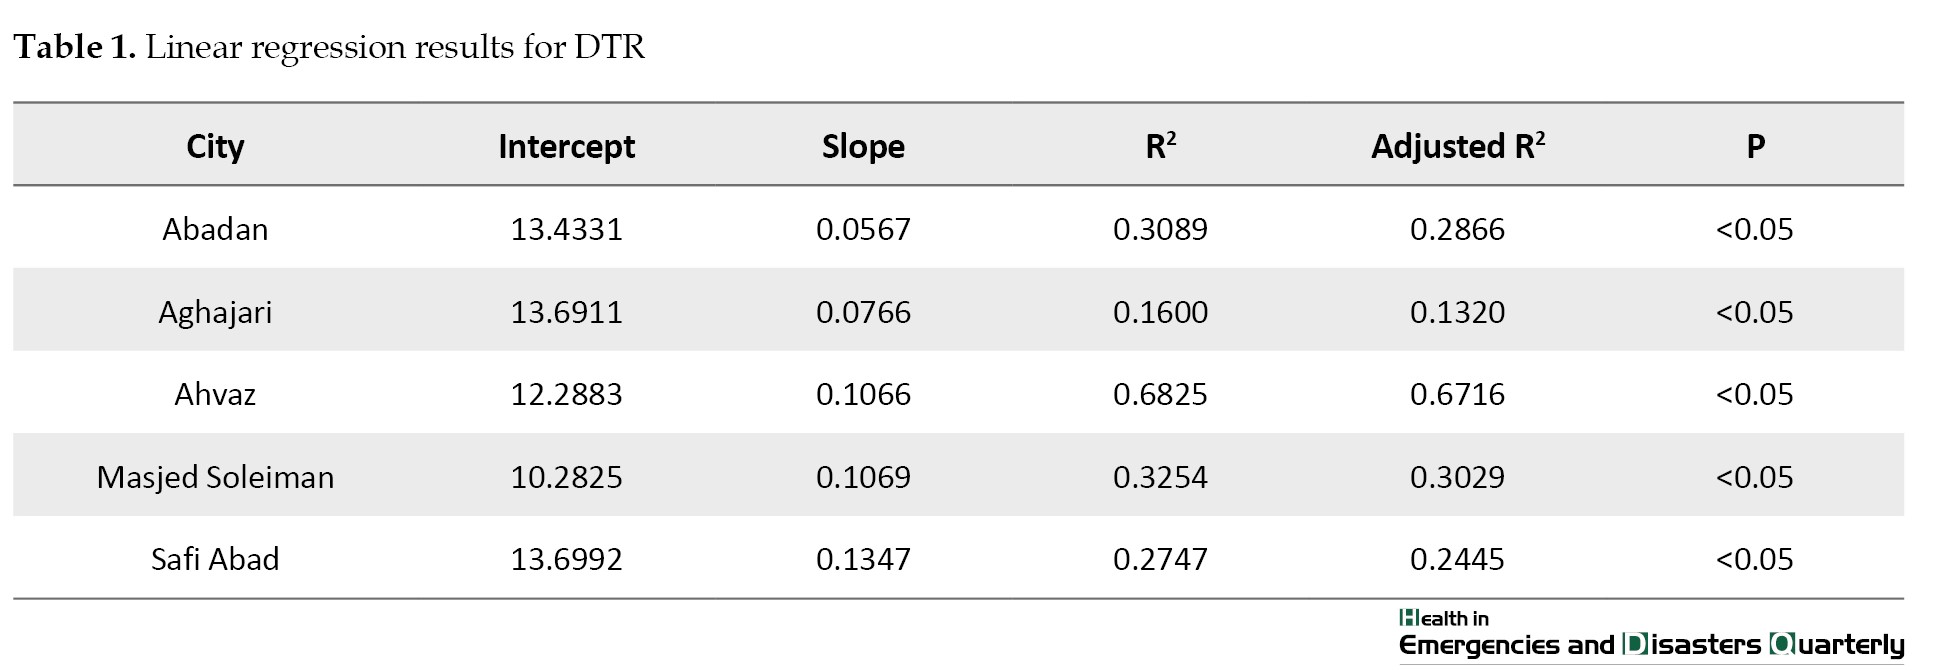
The linear regression analysis for DTR in Abadan indicates a positive relationship between the year and DTR. The regression equation, DTR=0.0567×year +13.4331, suggests a gradual annual increase in DTR by approximately 0.0567 units per year. The R2 value of 0.3089 and adjusted R2 value of 0.2866 indicate that around 29% of the variability in DTR is explained by the temporal trend. The P of 7.8540e-04 confirms that this increasing trend is statistically significant. This finding aligns with the observed long-term trend in DTR, as seen in the seasonal decomposition plot.
The linear regression analysis for DTR in Aghajari provides valuable insights. The regression equation, DTR=0.0766×year +13.6911, indicates a gradual annual increase in DTR by approximately 0.0766 units per year. The R2 value of 0.1600 and adjusted R2 value of 0.1320 suggest that 16% of the variability in DTR is explained by the temporal trend. The P of 2.3324e-02 confirms that the increasing trend is statistically significant. This result aligns with the observed trend component in the seasonal decomposition, supporting a gradual rise in DTR over the years in Aghajari.
The linear regression results for DTR in Ahvaz reveal a significant upward trend over the years. The regression equation, DTR=0.1066×year+12.2883, indicates an annual increase in DTR by approximately 0.1066 units. The R2 value of 0.6825 and adjusted R-squared value of 0.6716 suggest that 68% of the variability in DTR is explained by the temporal trend. The P of 1.0425e-08 confirms that this trend is statistically significant. These findings align with the observed upward trend in the seasonal decomposition plot and reflect the consistent increase in temperature differences over time in Ahvaz.
The linear regression analysis for DTR in Masjed Soleiman reveals a statistically significant upward trend over the years. The regression equation, DTR=0.1069×year+10.2825, indicates an annual increase in DTR by approximately 0.1069 units. The R2 value of 0.3254 and adjusted R2 value of 0.3029 suggest that around 30% of the variability in DTR is explained by the temporal trend. The P of 6.5261e-04 confirms the statistical significance of this trend. These findings align with the observed trend in the seasonal decomposition plot, highlighting a general increase in DTR over time in Masjed Soleiman.
The linear regression results for Safi Abad indicate a statistically significant upward trend in DTR over time. The regression equation, DTR=0.1347×year +13.6992, suggests an annual increase in DTR by approximately 0.1347 units. The R2 value of 0.2747 and adjusted R2 value of 0.2445 indicate that approximately 27% of the variability in DTR is explained by the temporal trend. The P of 5.9895e-03 confirms the significance of this trend. These results align with the observed trend component, confirming a gradual increase in temperature variability between day and night in Safi Abad over the study period (Table 1).
Seasonal decomposition plot of DTR
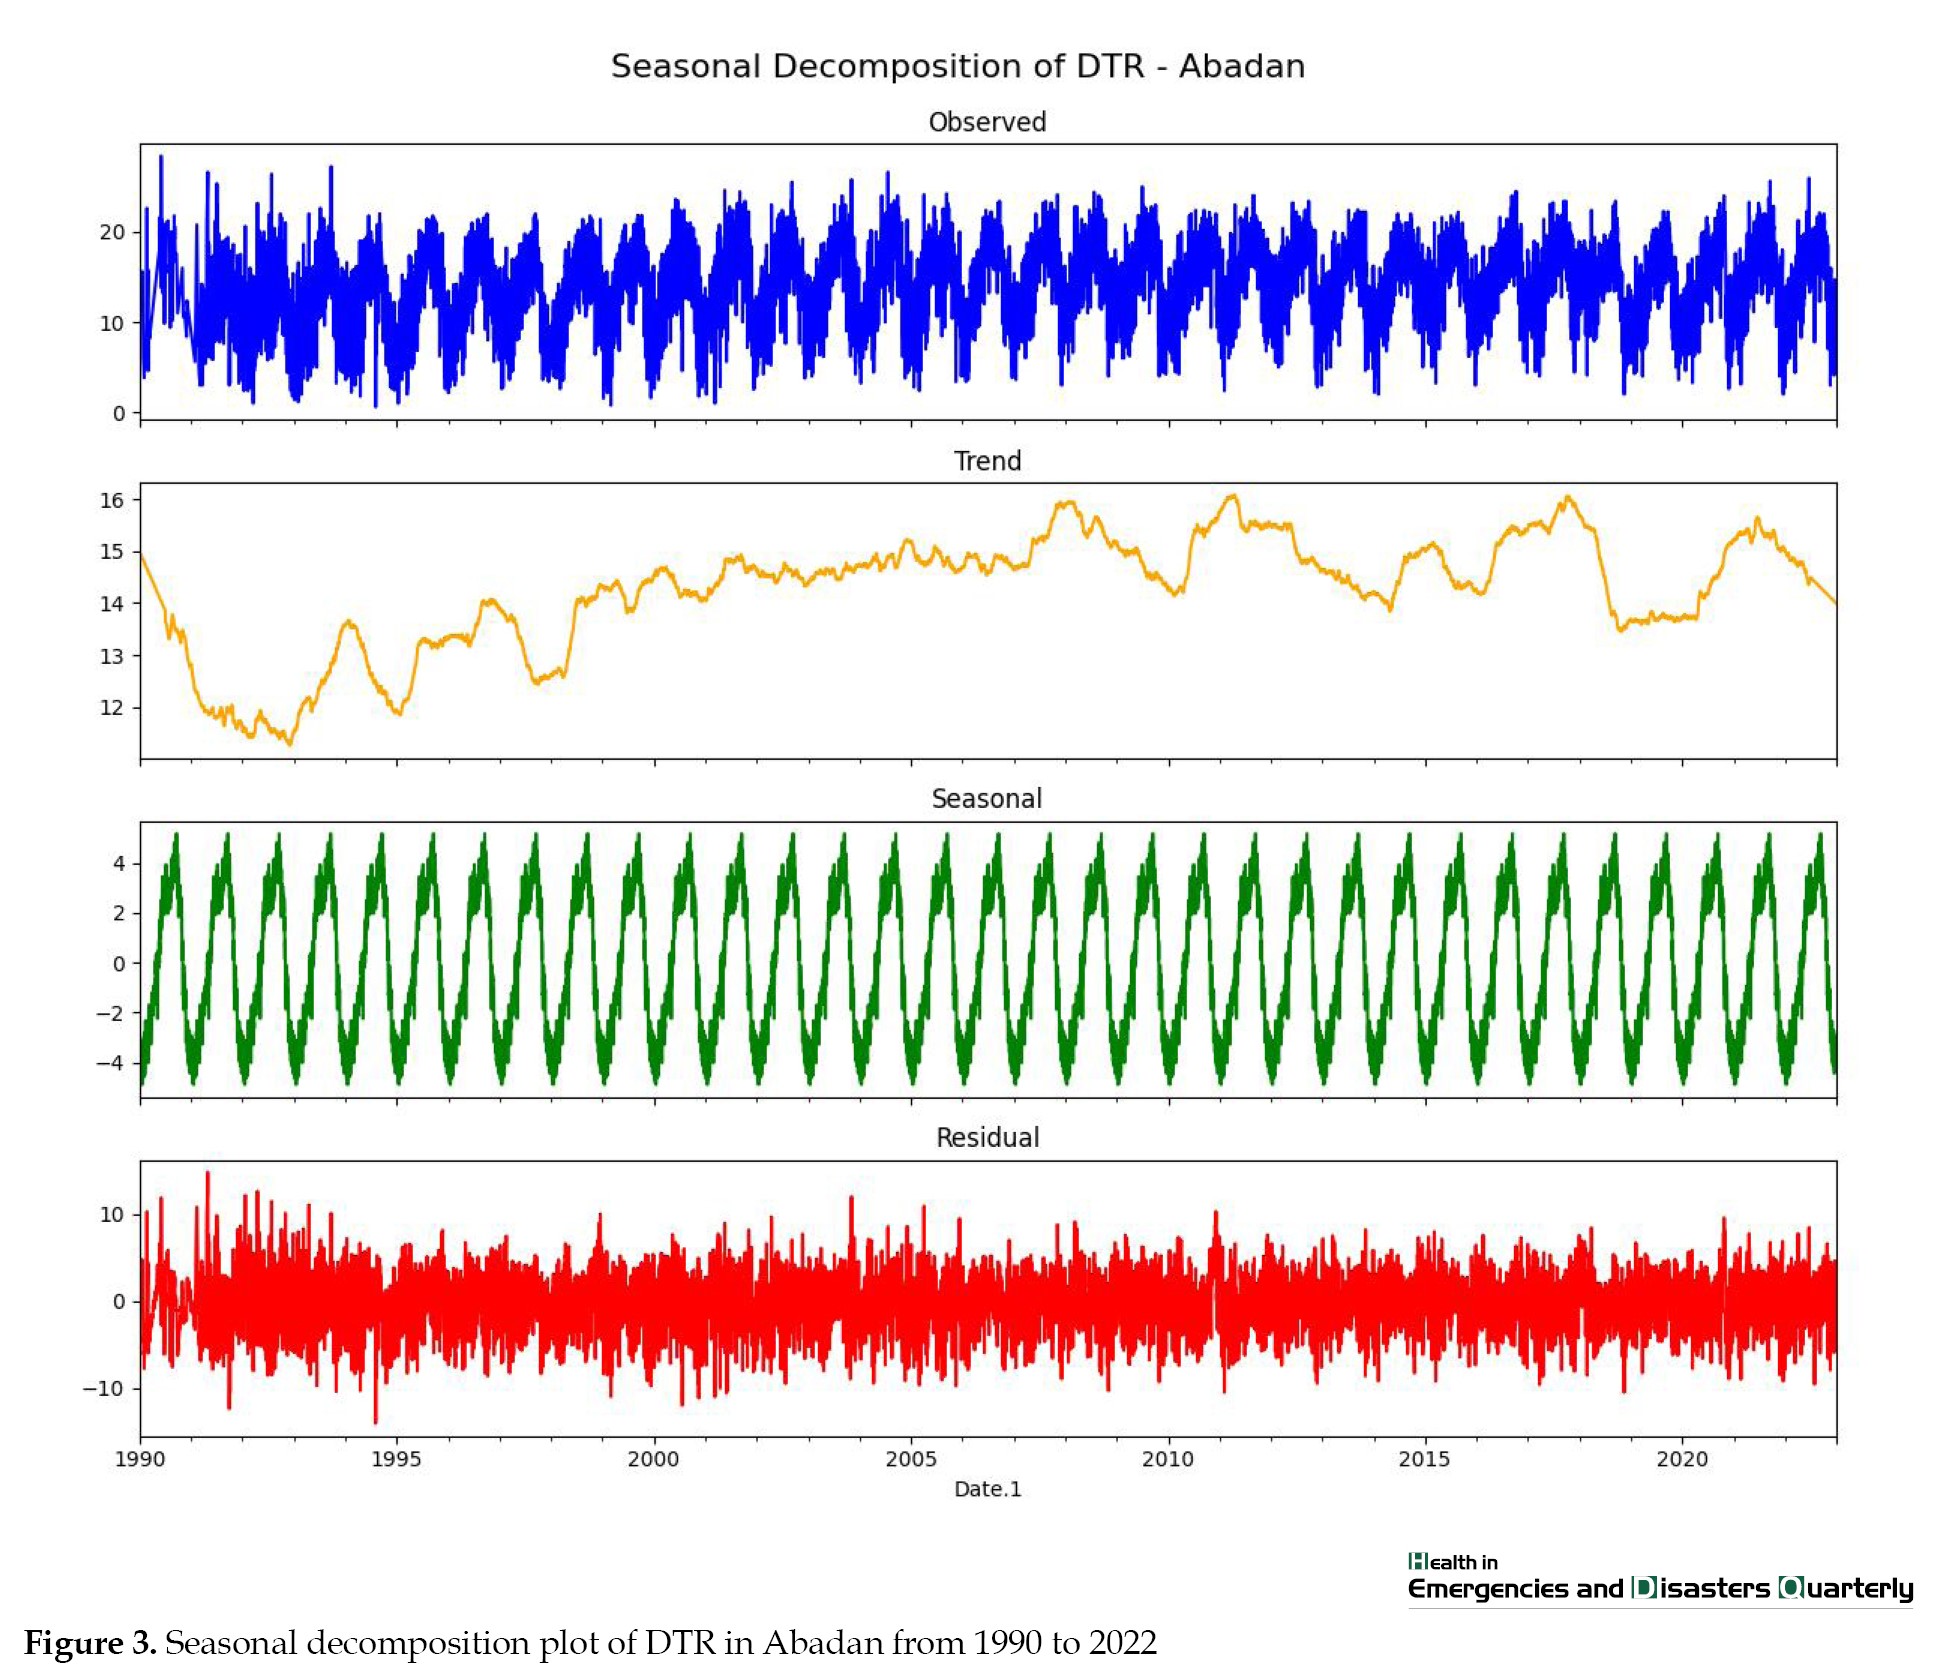
The seasonal decomposition plot of DTR in Abadan reveals distinct components of temperature variability. The observed component shows clear annual fluctuations in DTR, with peaks during the summer months and troughs during the winter months, reflecting the seasonal climate of Abadan. The trend component exhibits a decline in DTR from 1990 to approximately 1995, followed by a gradual increase and stabilization around 2005–2015, before a slight decline in recent years. The seasonal component demonstrates a highly consistent cyclical pattern across the entire timeline, highlighting the predictable seasonal variation in day-to-night temperature differences. The residual component, capturing irregular variations, includes noticeable spikes around 1990 and 2015, indicating anomalies potentially linked to extreme weather events or data irregularities (Figure 3).
Linear regression results for DTR
The linear regression analysis for DTR in Abadan indicates a positive relationship between the year and DTR. The regression equation, DTR=0.0567×year +13.4331, suggests a gradual annual increase in DTR by approximately 0.0567 units per year. The R2 value of 0.3089 and adjusted R2 value of 0.2866 indicate that around 29% of the variability in DTR is explained by the temporal trend. The P of 7.8540e-04 confirms that this increasing trend is statistically significant. This finding aligns with the observed long-term trend in DTR, as seen in the seasonal decomposition plot.
The linear regression analysis for DTR in Aghajari provides valuable insights. The regression equation, DTR=0.0766×year +13.6911, indicates a gradual annual increase in DTR by approximately 0.0766 units per year. The R2 value of 0.1600 and adjusted R2 value of 0.1320 suggest that 16% of the variability in DTR is explained by the temporal trend. The P of 2.3324e-02 confirms that the increasing trend is statistically significant. This result aligns with the observed trend component in the seasonal decomposition, supporting a gradual rise in DTR over the years in Aghajari.
The linear regression results for DTR in Ahvaz reveal a significant upward trend over the years. The regression equation, DTR=0.1066×year+12.2883, indicates an annual increase in DTR by approximately 0.1066 units. The R2 value of 0.6825 and adjusted R-squared value of 0.6716 suggest that 68% of the variability in DTR is explained by the temporal trend. The P of 1.0425e-08 confirms that this trend is statistically significant. These findings align with the observed upward trend in the seasonal decomposition plot and reflect the consistent increase in temperature differences over time in Ahvaz.
The linear regression analysis for DTR in Masjed Soleiman reveals a statistically significant upward trend over the years. The regression equation, DTR=0.1069×year+10.2825, indicates an annual increase in DTR by approximately 0.1069 units. The R2 value of 0.3254 and adjusted R2 value of 0.3029 suggest that around 30% of the variability in DTR is explained by the temporal trend. The P of 6.5261e-04 confirms the statistical significance of this trend. These findings align with the observed trend in the seasonal decomposition plot, highlighting a general increase in DTR over time in Masjed Soleiman.
The linear regression results for Safi Abad indicate a statistically significant upward trend in DTR over time. The regression equation, DTR=0.1347×year +13.6992, suggests an annual increase in DTR by approximately 0.1347 units. The R2 value of 0.2747 and adjusted R2 value of 0.2445 indicate that approximately 27% of the variability in DTR is explained by the temporal trend. The P of 5.9895e-03 confirms the significance of this trend. These results align with the observed trend component, confirming a gradual increase in temperature variability between day and night in Safi Abad over the study period (Table 1).
Seasonal decomposition plot of DTR
The seasonal decomposition plot of DTR in Abadan reveals distinct components of temperature variability. The observed component shows clear annual fluctuations in DTR, with peaks during the summer months and troughs during the winter months, reflecting the seasonal climate of Abadan. The trend component exhibits a decline in DTR from 1990 to approximately 1995, followed by a gradual increase and stabilization around 2005–2015, before a slight decline in recent years. The seasonal component demonstrates a highly consistent cyclical pattern across the entire timeline, highlighting the predictable seasonal variation in day-to-night temperature differences. The residual component, capturing irregular variations, includes noticeable spikes around 1990 and 2015, indicating anomalies potentially linked to extreme weather events or data irregularities (Figure 3).
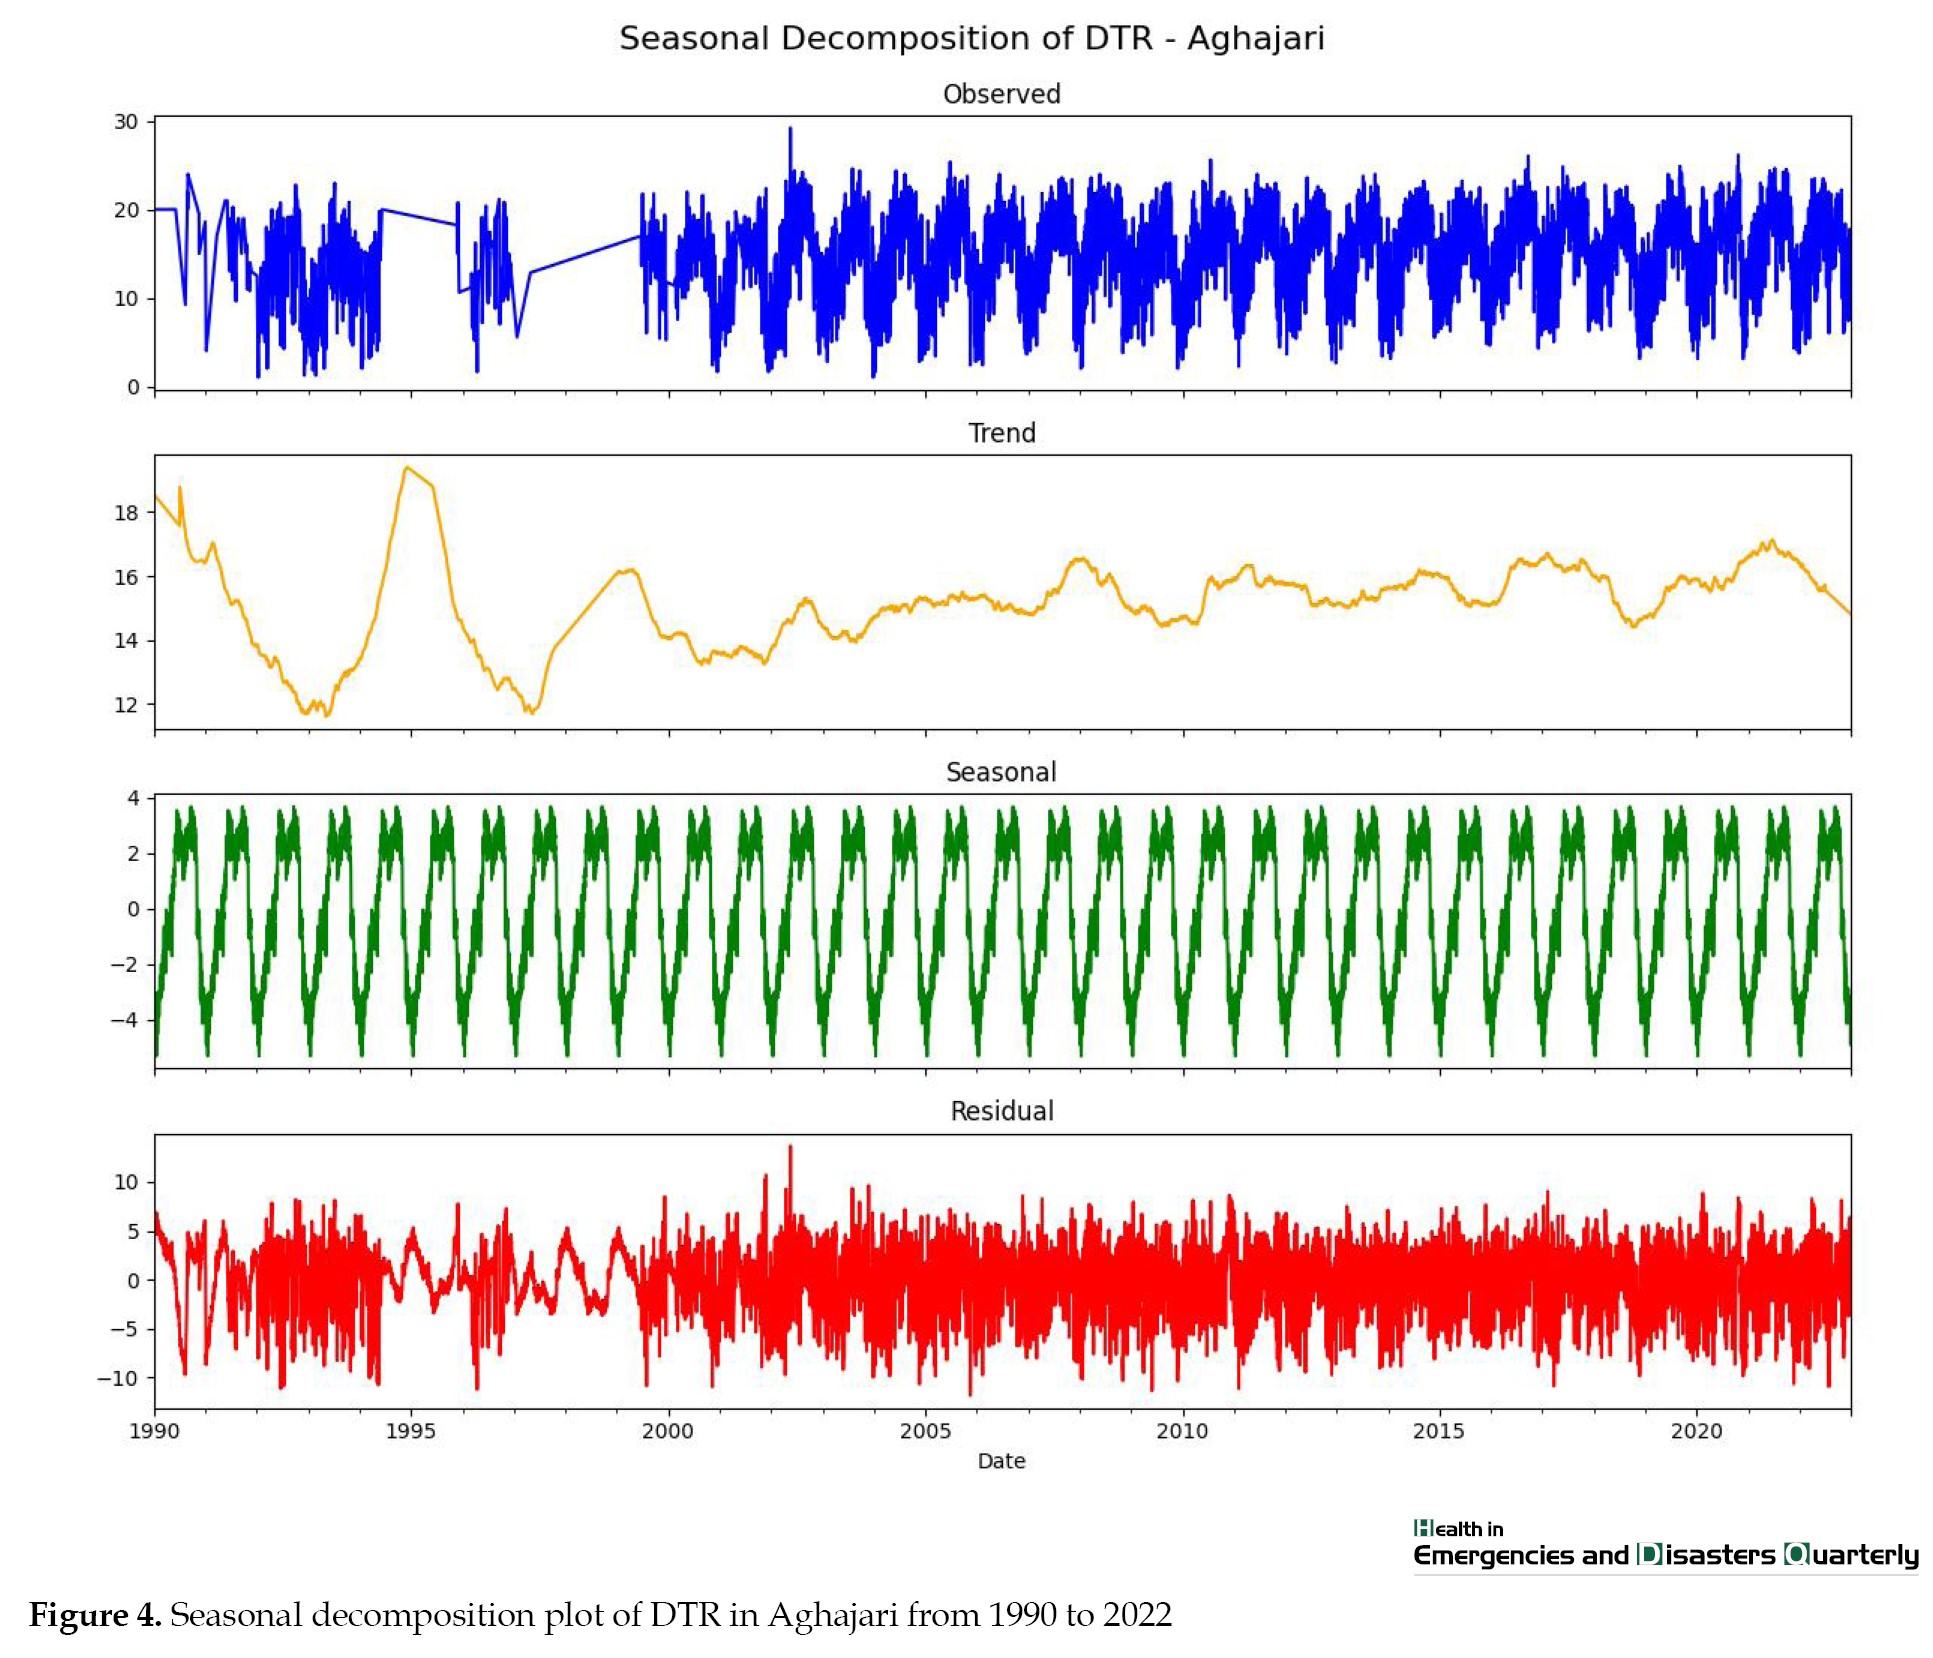
The seasonal decomposition of DTR in Aghajari illustrates the components of temperature variability. The observed component reveals pronounced seasonal fluctuations in DTR, with annual peaks and troughs reflecting the region’s climatic seasonality. The trend component shows a decline in DTR from 1990 to around 1995, followed by an increase and stabilization from 2000 to 2015, before a slight decline after 2015. The seasonal component demonstrates a consistent annual cyclical pattern, highlighting the persistent influence of seasonal climatic variations. The residual component, capturing irregular variations, shows notable spikes in the early 1990s and around 2010, indicating potential anomalies or extreme events affecting temperature variability (Figure 4).
The seasonal decomposition of DTR in Ahvaz reveals distinct components. The observed component displays annual peaks and troughs, highlighting a strong seasonal fluctuation in DTR. The trend component shows a steady increase in DTR from 1990 to the early 2000s, stabilizing afterward, with minor fluctuations until the end of the timeline. The seasonal component maintains a consistent annual pattern throughout the years, emphasizing the strong seasonal influences on temperature variability. The residual component captures irregularities, with noticeable spikes in the early 1990s and around 2010, potentially reflecting extreme weather events or anomalies in data collection (Figure 5).
The seasonal decomposition of DTR in Masjed Soleiman provides insights into its components. The observed component displays pronounced annual fluctuations with strong peaks and troughs, reflecting the region’s climatic seasonality. The trend component shows a gradual decline in DTR from 1990 to the mid-1990s, followed by a significant increase until the early 2000s and stabilization afterward, with a slight decline in the most recent years. The seasonal component maintains a consistent cyclical pattern, highlighting the predictable influence of seasonal climatic variations. The residual component captures irregular variations, with noticeable spikes in the early 1990s and around 2010, indicating potential anomalies or extreme weather events (Figure 6).
The seasonal decomposition of DTR in Safi Abad provides a breakdown of temperature variability. The observed component reveals pronounced seasonal peaks and troughs, highlighting annual fluctuations in DTR. The trend component shows an initial sharp increase in DTR during the mid-1990s, followed by a stabilization phase post-2000, with minor fluctuations in recent years. The seasonal component demonstrates a consistent and predictable pattern of variation throughout the timeline, reflecting the persistent impact of seasonal climatic influences. The residual component shows irregularities, particularly spikes in the early 2000s, likely indicating anomalies or extreme weather events influencing DTR variability (Figure 7).
Discussion
The DTR, defined as the difference between daily maximum and minimum temperatures, has significant implications for human health and mortality. This study aimed to evaluate the trends of DTR in 5 cities of Khuzestan Province from 1990 to 2022. Our analysis of data from these five cities reveals notable variations in DTR, showcasing how local climatic conditions can differ markedly even within the same region. Specifically, Abadan exhibited a median DTR ranging from 23.8 to 28.5 °C during the period from 1995 to 2020. This relatively stable yet notably high DTR suggests potential implications for human health and agriculture. Aghajari displayed an even higher median DTR, particularly in 2021, with values soaring between 27.4 and 30.6 °C. Increased DTR is linked to heightened heat stress, which poses serious risks to public health, especially in arid regions [18]. The pronounced increase in DTR in specific cities underscores the necessity for ongoing monitoring and analysis of environmental conditions that lead to such extremes. A study conducted by Akhlaghi-Hosseiny et al. on the trends of DTR in Iran using the AgERA5 dataset demonstrated how urbanization and land-use changes significantly influence local climate conditions, aligning with our findings in Khuzestan. Their research provided evidence of regional disparities in DTR trends and emphasized the importance of monitoring these fluctuations for better urban planning and health policy development [19].
Conversely, the trend in Masjed Soleyman was not statistically significant (P=0.773), indicating a more stable climatic pattern that might be influenced by local topographical features or microclimates that mitigate temperature fluctuations. The significant trends observed in cities like Ahvaz and Safi Abad signal an urgent need for policy interventions. Increasing DTR correlates with greater variability in extreme temperatures, leading to more frequent instances of heat-related illnesses. Sharafkhani et al. examined the association between DTR and mortality in Tabriz, showing that increased DTR was significantly linked to higher mortality rates, particularly among vulnerable groups such as the elderly. This research underscores the health risks posed by temperature fluctuations and suggests that similar risks might be present in Khuzestan’s population due to its high DTR levels [20]. Overall, our analysis indicates that the trend of DTR is increasing across all five cities. These findings highlight the importance of incorporating DTR into health action plans, particularly for preparing for heatwaves and other climate-related health risks [21, 22]. This study also aligns with global analyses indicating a general increase in DTR since the 1980s, with variations across different continents [23, 24]. In Europe and Asia, significant increases in DTR have been attributed to greater warming of maximum temperatures compared to minimum temperatures. This trend suggests that urbanization and land use changes may contribute to altering local climate patterns, including DTR [25, 26].
High DTR can lead to increased instances of heat stress, particularly during summer months. When temperatures fluctuate significantly between day and night, it can strain the body’s ability to regulate temperature, leading to conditions, such as heat exhaustion and heat stroke [27]. Research indicates that DTR might serve as an effective indicator of the relationship between temperature variations and mortality. Temperature fluctuations have significant health-related consequences. Recent studies show a strong association between severe changes in DTR and mortality related to cardiovascular and respiratory diseases [28]. Aghababaeian et al. investigated the impact of DTR on hospital admissions due to cardiovascular and respiratory diseases in Dezful, another city in Khuzestan Province. Their study revealed that high DTR is strongly associated with increased hospital admissions, particularly during periods of extreme weather. These findings reinforce the critical need for local preventive measures to mitigate the health impacts of DTR in vulnerable regions [17]. Notably, DTR has emerged as a new risk factor for sudden infant death syndrome (SIDS) [29]. Furthermore, extreme DTR variations can result in increased heart rate, elevated blood pressure, and a heightened risk of cardiovascular issues [10]. Elevated DTR, particularly when coupled with high humidity, may also raise the incidence of influenza [30]. Elevated temperatures associated with high DTR can worsen air quality, particularly increasing levels of ground-level ozone [31]. This deterioration can lead to respiratory problems and increased hospital admissions.
Factors, such as gender, age, and season, may influence the impact of DTR on health [10]. The elderly and children are more vulnerable to the effects of DTR [10]. Moreover, socio-economic and educational status can influence how DTR impacts health outcomes. Research shows that individuals aged 75 and older are at a significantly higher risk of mortality associated with DTR [32]. Increased DTR could also lead to a rise in certain viral infections, particularly among children [33]. Implementing preventive programs targeting high-risk subgroups, such as the elderly, may mitigate the health impacts of significant temperature changes [34]. Extreme temperature variations can also impact mental health. Studies have shown that increased DTR correlates with higher rates of mental health issues, including anxiety and depression [35]. The stress of coping with extreme temperatures can lead to increased psychological distress, particularly in populations already facing socio-economic challenges [36].
Fluctuations in temperature can influence the transmission dynamics of infectious diseases. For instance, certain pathogens thrive in specific temperature ranges, and significant changes in DTR can alter the prevalence and spread of diseases like malaria and dengue fever, further complicating public health responses [37, 38].
The established role of DTR as an independent risk factor for mortality, alongside other meteorological indicators, highlights the need for continued research and the development of informed public health policies [8, 39]. Localized studies are essential for understanding regional climate dynamics and informing public health policies that prioritize community resilience [40]. Given the limited studies conducted in Iran and considering that Khuzestan is one of the provinces with high average temperatures and potentially significant impacts from climate change, examining the DTR trend is crucial. Due to the limited number of collected data in some years, we considered only those years in which 90% of the meteorological data were recorded. The trend of increasing DTR observed in all five cities suggests that future studies could explore the relationship between DTR trends and mortality rates, as well as emergency department admissions in these cities. Further research is needed to understand the adverse effects of DTR in different geographic locations. It is recommended that preventive measures be implemented to protect vulnerable populations from the severe adverse effects of DTR.
Conclusion
The trend of DTR has shown an increase across all five cities in Khuzestan, highlighting potential implications for public health in the region. This increasing trend suggests a growing need to assess its direct and indirect impacts on health, particularly among vulnerable populations, such as the elderly, children, and individuals with pre-existing conditions. Future studies may explore the relationship between this trend and mortality rates, as well as its impact on public health in these cities. Additionally, investigating the role of other contributing factors, such as urbanization and land use changes, in shaping DTR trends could provide a more comprehensive understanding. The DTR is a globally suitable indicator for reflecting climatic changes and their health implications. Examining the DTR trend in Khuzestan is particularly important due to its high average temperatures and extreme climatic conditions, which may be significantly affected by climate change. Policymakers should prioritize integrating DTR monitoring into regional and national health strategies. Long-term intervention policies, such as incorporating DTR into future health action plans, especially among vulnerable communities, could help mitigate the adverse health effects of DTR. Public awareness campaigns and adaptive measures should also be implemented to enhance community resilience to temperature fluctuations. As a researcher, several policy and executive suggestions are proposed based on the study findings. First, establishing a DTR monitoring system is essential. This involves developing a comprehensive and continuous monitoring network across Khuzestan to assess trends and identify high-risk areas. Additionally, incorporating DTR-related risks into regional and national health policies is crucial, particularly with a focus on vulnerable groups such as the elderly and individuals with chronic diseases. Urban planning adjustments also play a significant role in mitigating the effects of temperature fluctuations. Encouraging green infrastructure and sustainable urban design can help reduce the adverse impacts of extreme DTR, especially in densely populated areas. Public education campaigns should be initiated to raise awareness about the potential health risks associated with extreme DTR fluctuations and to promote adaptive behaviors at the community level. Lastly, strengthening collaboration between health, environmental, and meteorological agencies is vital. Such partnerships can facilitate the development of integrated strategies to reduce climate-related health risks and enhance resilience in affected regions. This study may contribute to better targeting of vulnerable populations and the development of effective strategies. Ultimately, these efforts could support evidence-based policymaking aimed at minimizing the health risks associated with changing climatic conditions in Khuzestan and similar regions globally.
Ethical Considerations
Compliance with ethical guidelines
This study was approved by the Tehran University of Medical Sciences, Tehran, Iran (Code: IR.TUMS.SPH.REC.1402.221).
Funding
This study was funded by the Center for Air Pollution Research (CAPR), Institute for Environmental Research (IER), Tehran University of Medical Sciences, Tehran, Iran (Project No.: 1402-3-462-65769).
Authors' contributions
Study design and writing the original draft: Masoumeh Gharaee and Mostafa Hadei; Data analysis: Mostafa Hadei, Masoumeh Gharaee and Hossein Zeraati; Review and editing: Hossein Zeraati, Abbas Sadeghi, and Samira Karimi; Supervision: Masoumeh Gharaee and Mostafa Hadei; Funding: Mostafa Hadei; Data collection and final approval: All authors.
Conflict of interest
The authors declared no conflict of interests.
Acknowledgments
The authors wish to thank the Center for Air Pollution Research (CAPR), Institute for Environmental Research (IER), Tehran University of Medical Sciences, Tehran, Iran, for financial support of this study.
References
- Sharafkhani R, Khanjani N, Bakhtiari B, Jahani Y, Entezar Mahdi R. Diurnal temperature range and mortality in Urmia, the Northwest of Iran. Journal of Thermal Biology. 2017; 69:281-7. [DOI:10.1016/j.jtherbio.2017.08.011] [PMID]
- Kan H, London SJ, Chen H, Song G, Chen G, Jiang L, et al. Diurnal temperature range and daily mortality in Shanghai, China. Environmental Research. 2007; 103(3):424-31. [DOI:10.1016/j.envres.2006.11.009] [PMID]
- Hadei M, Yousefian F. 6 - Global air quality and climate change. In: Basile A, Saloglu D, Cassano A, editors. Air Pollution, Air Quality, and Climate Change. Amsterdam: Elsevier; 2025. [DOI:10.1016/B978-0-443-23816-1.00008-2]
- St Louis ME, Hess JJ. Climate change: Impacts on and implications for global health. American Journal of Preventive Medicine. 2008; 35(5):527-38. [DOI:10.1016/j.amepre.2008.08.023] [PMID]
- Tabaei S, Hadei M, Pasalari N, Panahande M, Tabaee SS. Association between short-term exposure to PM and cardiovascular mortality in Iran: A systematic review and meta-analysis. Air Quality, Atmosphere & Health. 2023; 16(4):785-92. [DOI:10.1007/s11869-023-01307-2]
- Bolouki H, Fazeli M, Sharifzadeh M. [Investigating the trend of some climatic parameters in three south coast provinces of Iran, and identifying the areas most affected by climate change (Persian)]. Climate Change Research. 2021; 2(6):47-62. [DOI:10.30488/ccr.2021.284727.1044]
- Broomandi P, Satyanaga A, Bagheri M, Hadei M, Galán-Madruga D, Fard AM, et al. Extreme temperature events in Kazakhstan and their impacts on public health and energy demand. Global Challenges. 2024; 9(2):2400207. [DOI:10.1002/gch2.202400207] [PMID]
- Hadei M, Hopke PK, Aghababaeian H, Faridi S, Hasham Firooz M, Ostadtaghizadeh A. Association of heat and cold waves with cause-specific mortality in Iran: A systematic review and meta-analysis. Scientific Reports. 2024; 14(1):23327. [DOI:10.1038/s41598-024-74821-7] [PMID]
- Abbaspour KC, Faramarzi M, Ghasemi SS, Yang H. Assessing the impact of climate change on water resources in Iran. Water Resources Research. 2009; 45(10). [DOI:10.1029/2008WR007615]
- Cheng J, Xu Z, Zhu R, Wang X, Jin L, Song J, et al. Impact of diurnal temperature range on human health: A systematic review. International Journal of Biometeorology. 2014; 58(9):2011-24. [DOI:10.1007/s00484-014-0797-5] [PMID]
- Sun X, Ren G, You Q, Ren Y, Xu W, Xue X, et al. Global diurnal temperature range (DTR) changes since 1901. Climate Dynamics. 2019; 52:3343-56. [DOI:10.1007/s00382-018-4329-6]
- Zhai G, Zhang K, Zhou W, Wu T. Impact of diurnal temperature range on hospital admissions for cardiovascular disease in Jiuquan, China. Urban Climate. 2021; 38:100915. [DOI:10.1016/j.uclim.2021.100915]
- Phosri A, Sihabut T, Jaikanlaya C. Short-term effects of diurnal temperature range on hospital admission in Bangkok, Thailand. Science of The Total Environment. 2020; 717:137202. [DOI:10.1016/j.scitotenv.2020.137202] [PMID]
- Dehghani A, Ghomian Z, Rakhshanderou S, Khankeh H, Kavousi A. National documents analysis of risk communication in Iran: Based on disaster risk management cycle. Shiraz E-Medical Journal. 2022; 23(12):e131237. [DOI:10.5812/semj-131237]
- Lee W, Kim Y, Sera F, Gasparrini A, Park R, Choi HM, et al. Projections of excess mortality related to diurnal temperature range under climate change scenarios: A multi-country modelling study. The Lancet Planetary Health. 2020; 4(11):e512-e21. [DOI:10.1016/S2542-5196(20)30222-9] [PMID]
- Mohammadi Z, Rahimi D, Najafi MR, Zakerinejad R. The impact of environmental degradation and climate change on dust in Khuzestan province, Iran. Natural Hazards. 2024; 120(5):4329-48. [DOI:10.1007/s11069-023-06368-1]
- Aghababaeian H, Sharafkhani R, Kiarsi M, Mehranfar S, Moosavi A, Araghi Ahvazi L, et al. Diurnal temperature range and hospital admission due to cardiovascular and respiratory diseases in Dezful, a city with hot climate and high DTR fluctuation in Iran: An ecological time-series study. Environmental Geochemistry and Health. 2023; 45(7):4915-27. [DOI:10.1007/s10653-023-01533-8] [PMID]
- Pradyumna A, Bendapudi R, Zade D, D’Souza M. Health vulnerability to heat stress in rural communities of the semi-arid regions of Maharashtra, India. Cape Town: ASSAR; 2018. [Link]
- Akhlaghi-Hosseiny SF, Zarrin A, Dadashi-Roudbari A. [Examining the diurnal temperature range (DTR) in Iran using the AgERA5 dataset (Persian)]. Journal of Geography and Environmental Hazards. 2023; 12(1):189-208. [Link]
- Sharafkhani R, Khanjani N, Bakhtiari B, Jahani Y, Tabrizi JS, Tabrizi FM. Diurnal temperature range and mortality in Tabriz (the northwest of Iran). Urban Climate. 2019; 27:204-11. [DOI:10.1016/j.uclim.2018.11.004]
- Hess JJ, Errett NA, McGregor G, Busch Isaksen T, Wettstein ZS, Wheat SK, et al. Public health preparedness for extreme heat events. Annual Review of Public Health. 2023; 44(1):301-21. [DOI:10.1146/annurev-publhealth-071421-025508] [PMID]
- Ebi KL, Capon A, Berry P, Broderick C, de Dear R, Havenith G, et al. Hot weather and heat extremes: Health risks. The Lancet. 2021; 398(10301):698-708. [DOI:10.1016/S0140-6736(21)01208-3] [PMID]
- Huang X, Dunn RJ, Li LZ, McVicar TR, Azorin-Molina C, Zeng Z. Increasing global terrestrial diurnal temperature range for 1980-2021. Geophysical Research Letters. 2023; 50(11):e2023GL103503. [Link]
- Thorne P, Donat M, Dunn R, Williams C, Alexander L, Caesar J, et al. Reassessing changes in diurnal temperature range: Intercomparison and evaluation of existing global data set estimates. Journal of Geophysical Research: Atmospheres. 2016; 121(10):5138-58. [DOI:10.1002/2015JD024584]
- Wiesner S, Bechtel B, Fischereit J, Gruetzun V, Hoffmann P, Leitl B, et al. Is it possible to distinguish global and regional climate change from urban land cover induced signals? A mid-latitude city example. Urban Science. 2018; 2(1):12. [DOI:10.3390/urbansci2010012]
- Lim YK, Cai M, Kalnay E, Zhou L. Observational evidence of sensitivity of surface climate changes to land types and urbanization. Geophysical Research Letters. 2005; 32(22). [DOI:10.1029/2005GL024267]
- Savioli G, Zanza C, Longhitano Y, Nardone A, Varesi A, Ceresa IF, et al. Heat-related illness in emergency and critical care: Recommendations for recognition and management with medico-legal considerations. Biomedicines. 2022; 10(10):2542. [DOI:10.3390/biomedicines10102542] [PMID]
- Tang H, Wang X, Kang Y, Zheng C, Cao X, Tian Y, et al. Long-Term impacts of diurnal temperature range on mortality and cardiovascular disease: A nationwide prospective cohort study. Metabolites. 2022; 12(12):1287. [DOI:10.3390/metabo12121287] [PMID]
- Chu C, Zhou W, Gui Y, Kan H. Diurnal temperature range as a novel risk factor for sudden infant death. Biomedical and Environmental Sciences. 2011; 24(5):518-22. [PMID]
- Park JE, Son WS, Ryu Y, Choi SB, Kwon O, Ahn I. Effects of temperature, humidity, and diurnal temperature range on influenza incidence in a temperate region. Influenza and Other Respiratory Viruses. 2020; 14(1):11-18. [DOI:10.1111/irv.12682] [PMID]
- Madronich S, Shao M, Wilson SR, Solomon KR, Longstreth JD, Tang XY. Changes in air quality and tropospheric composition due to depletion of stratospheric ozone and interactions with changing climate: Implications for human and environmental health. Photochemical & Photobiological Sciences. 2015; 14(1):149-69. [DOI:10.1039/c4pp90037e] [PMID]
- Zhang Y, Yu C, Yang J, Zhang L, Cui F. Diurnal temperature range in relation to daily mortality and years of life lost in Wuhan, China. International Journal of Environmental Research and Public Health. 2017; 14(8):891. [DOI:10.3390/ijerph14080891] [PMID]
- Yin F, Ma Y, Zhao X, Lv Q, Liu Y, Zhang T, et al. The association between diurnal temperature range and childhood hand, foot, and mouth disease: A distributed lag non-linear analysis. Epidemiology and Infection. 2017; 145(15):3264-73. [DOI:10.1017/S0950268817002321] [PMID]
- Zheng S, Wang M, Li B, Wang S, He S, Yin L, et al. Gender, age and season as modifiers of the effects of diurnal temperature range on emergency room admissions for cause-specific cardiovascular disease among the elderly in Beijing. International Journal of Environmental Research and Public Health. 2016; 13(5):447. [DOI:10.3390/ijerph13050447] [PMID]
- Nori-Sarma A, Galea S. Climate change and mental health: A call for a global research agenda. The Lancet Psychiatry. 2024; 11(5):316-7. [DOI:10.1016/S2215-0366(24)00098-1] [PMID]
- Rony MKK, Alamgir HM. High temperatures on mental health: Recognizing the association and the need for proactive strategies-A perspective. Health Science Reports. 2023; 6(12):e1729. [DOI:10.1002/hsr2.1729] [PMID]
- Mordecai EA, Caldwell JM, Grossman MK, Lippi CA, Johnson LR, Neira M, et al. Thermal biology of mosquito‐borne disease. Ecology Letters. 2019; 22(10):1690-708. [DOI:10.1111/ele.13335] [PMID]
- Murdock CC, Sternberg ED, Thomas MB. Malaria transmission potential could be reduced with current and future climate change. Scientific Reports. 2016; 6(1):27771. [DOI:10.1038/srep27771] [PMID]
- Lee W, Bell ML, Gasparrini A, Armstrong BG, Sera F, Hwang S, et al. Mortality burden of diurnal temperature range and its temporal changes: A multi-country study. Environment International. 2018; 110:123-30. [DOI:10.1016/j.envint.2017.10.018] [PMID]
- Pitman A, Arneth A, Ganzeveld L. Regionalizing global climate models. International Journal of Climatology. 2012; 32(3):321-37. [DOI:10.1002/joc.2279]
Type of article: Research |
Subject:
Quantitative
Received: 2024/10/28 | Accepted: 2025/03/5 | Published: 2025/10/1
Received: 2024/10/28 | Accepted: 2025/03/5 | Published: 2025/10/1
Send email to the article author
| Rights and permissions | |
 |
This work is licensed under a Creative Commons Attribution-NonCommercial 4.0 International License. |

Copyright © The Author(s);
This is an open access article distributed under the terms of the Creative Commons Attribution-NonCommercial 4.0 (CC-By-NC 4.0), which permits use, distribution, and reproduction in any medium, provided the original work is properly cited and is not used for commercial purposes.
Contact Information
This is an open access article distributed under the terms of the Creative Commons Attribution-NonCommercial 4.0 (CC-By-NC 4.0), which permits use, distribution, and reproduction in any medium, provided the original work is properly cited and is not used for commercial purposes.
Contact Information
